KSysGuard: Difference between revisions
(Premier jet traduction française) |
Thiagosueto (talk | contribs) (Link to System Activity) |
||
| (16 intermediate revisions by 7 users not shown) | |||
| Line 1: | Line 1: | ||
<languages /> | |||
{| | {|class="tablecenter vertical-centered" | ||
|[[Image:Ksysguard1.png|thumb|265px|The System Load page]]|| ''' | |[[Image:Ksysguard1.png|thumb|265px|<translate><!--T:14--> | ||
The System Load page</translate>]]||<translate> <!--T:1--> | |||
'''Track and control the processes running in your system.'''</translate> | |||
|} | |} | ||
<translate> | |||
==General== <!--T:2--> | |||
<!--T:3--> | |||
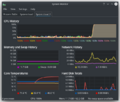
KSysGuard | '''KSysGuard''', also known as '''KDE System Guard''' and '''KDE System Monitor''', is designed to make simple process control available to a user without needing to do any special setup - the defaults are usually perfectly adequate. There are two worksheets - the <menuchoice>System Load</menuchoice> page, pictured above, and the <menuchoice>Process Table</menuchoice>. | ||
<!--T:15--> | |||
You can also download other tabs (File >> Download New Tabs), including temperatures, network and more. | |||
{| | ===System Load=== <!--T:4--> | ||
|[[Image:KsysguardCPU.png|thumb| | |||
<!--T:5--> | |||
The <menuchoice>System Load</menuchoice> screen has three displays, each representing one of the load considerations - CPU History, Memory and Swap History and Network History. If you hover over the title-bar of each section you will see detailed analysis together with a colour-key. | |||
<!--T:6--> | |||
{|class="tablecenter" | |||
|[[Image:KsysguardCPU.png|thumb|300px]]|| | |||
|} | |} | ||
{| | {|class="tablecenter" | ||
|[[Image:KsysguardRAM.png|thumb| | |[[Image:KsysguardRAM.png|thumb|300px]] | ||
|[[Image:KsysguardNet.png|thumb| | |[[Image:KsysguardNet.png|thumb|300px]] | ||
|} | |} | ||
== | ==The Process Table== <!--T:7--> | ||
<!--T:8--> | |||
The <menuchoice>All Processes</menuchoice> view by default gives you an alphabetical order list of all processes running. Clicking on any column header will make this the sort column. If you have a runaway process you will find the <menuchoice>All Processes, Tree</menuchoice> view most useful. You can also elect to see sub-sets of the processes, by owner or program. | |||
{| | <!--T:9--> | ||
|[[Image:Ksysguard2.png|thumb| | {|class="tablecenter" | ||
|[[Image:Ksysguard2.png|thumb|300px|The alphabetical list of processes]]||[[Image:KsysguardTree.png|thumb|300px| The tree view]] | |||
|} | |} | ||
==Hints and Tips== <!--T:10--> | |||
<!--T:11--> | |||
<keycap>Ctrl + Esc</keycap> brings up the ''Processes'' part of KSysGuard (formerly known as [https://userbase.kde.org/System_Activity System Activity]), which is very helpful when you are trying to find which application is using too many resources. | |||
<!--T:12--> | |||
In [[Special:myLanguage/KRunner|KRunner]] (<keycap>Alt + F2</keycap> or right click on the desktop and select <menuchoice>Run Command...</menuchoice> ) there is a tiny icon to the left of the entry bar - it looks like a microwave oven - that also brings up the Process Table. | |||
<!--T:16--> | |||
'''Editing Tabs''': Should you want to adjust a tab, you can find the corresponding .sgrd-file in ~/.local/share/ksysguard/. Once you set "locked" to 0, the sensor browser becomes visible after restarting ksysguard. Now you can drag any sensor from the right into any graph on the left. You can hide the sensor browser by using the slider or disabling it entirely by setting "locked" back to 1. | |||
Example: | |||
<gallery> | |||
SystemLoadAndTemps.png|3 temperature sensors added in "System Load And Temps" | |||
</gallery> | |||
<!--T:13--> | |||
[[Category:System]] | |||
</translate> | |||
Latest revision as of 04:49, 1 March 2024
 |
Track and control the processes running in your system. |
General
KSysGuard, also known as KDE System Guard and KDE System Monitor, is designed to make simple process control available to a user without needing to do any special setup - the defaults are usually perfectly adequate. There are two worksheets - the page, pictured above, and the .
You can also download other tabs (File >> Download New Tabs), including temperatures, network and more.
System Load
The screen has three displays, each representing one of the load considerations - CPU History, Memory and Swap History and Network History. If you hover over the title-bar of each section you will see detailed analysis together with a colour-key.
 |
 |
 |
The Process Table
The view by default gives you an alphabetical order list of all processes running. Clicking on any column header will make this the sort column. If you have a runaway process you will find the view most useful. You can also elect to see sub-sets of the processes, by owner or program.
 |
 |
Hints and Tips
Ctrl + Esc brings up the Processes part of KSysGuard (formerly known as System Activity), which is very helpful when you are trying to find which application is using too many resources.
In KRunner (Alt + F2 or right click on the desktop and select ) there is a tiny icon to the left of the entry bar - it looks like a microwave oven - that also brings up the Process Table.
Editing Tabs: Should you want to adjust a tab, you can find the corresponding .sgrd-file in ~/.local/share/ksysguard/. Once you set "locked" to 0, the sensor browser becomes visible after restarting ksysguard. Now you can drag any sensor from the right into any graph on the left. You can hide the sensor browser by using the slider or disabling it entirely by setting "locked" back to 1.
Example:
-
3 temperature sensors added in "System Load And Temps"
