Kdenlive/Підручник/Меню «Перегляд»/Звуковий спектр
Appearance
Звуковий спектр
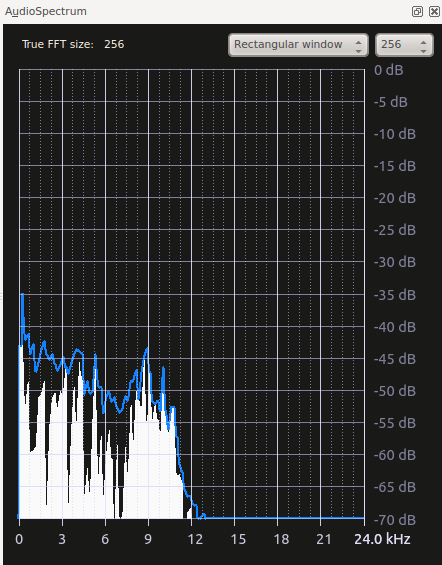
За допомогою цієї панелі ви можете стежити за властивостями звукових даних. Дані на графіку буде показано лише під час відтворення кліпу на моніторі кліпу або проєкту.
It graphs the loudness of the audio (in decibels - vertical axis) for each audio frequency (horizontal axis) in the current frame. The blue curve is +- the maximum over the previous few samples.
See also Spectrogram scope which displays a graphical representation of the audio spectrum over the entire clip.
For more information see Granjow's blog on Audio Spectrum

