KChart/da: Difference between revisions
(Updating to match new version of source page) |
(Updating to match new version of source page) |
||
| Line 1: | Line 1: | ||
<languages /> | <languages /> | ||
{|class="tablecenter vertical-centered" | {|class="tablecenter vertical-centered" | ||
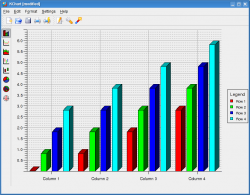
|[[Image:Kchart_3D.png|thumb|250px]]||'''Lav diagrammer, som kan indlejres i dine dokumenter og præsentationer''' | |[[Image:Kchart_3D.png|thumb|250px]]||'''Lav diagrammer, som kan indlejres i dine dokumenter og præsentationer''' | ||
|} | |} | ||
== History == | |||
'''KChart''' was the charting tool from [[Special:myLanguage/KOffice|KOffice]] and is still the charting tool from [[Special:myLanguage/Calligra|Calligra]]. In older version, '''KChart''' was a standalone application, now it's a part with KGantt of the '''KDiagram''' library used by other KDE applications (e.g. [[Special:myLanguage/Calligra|Calligra]] and [[Special:myLanguage/KMyMoney|KMyMoney]])<ref>[https://phabricator.kde.org/T2110 KChart is part of KDiagram]</ref>. | |||
== Features == | |||
'''Hovedpunkter''' | '''Hovedpunkter''' | ||
| Line 28: | Line 32: | ||
** Polær (Radar): normale | stablede | procent | ** Polær (Radar): normale | stablede | procent | ||
== | == References == | ||
[[Category:Kontor/da]] | [[Category:Kontor/da]] | ||
Revision as of 06:14, 12 February 2019
 |
Lav diagrammer, som kan indlejres i dine dokumenter og præsentationer |
History
KChart was the charting tool from KOffice and is still the charting tool from Calligra. In older version, KChart was a standalone application, now it's a part with KGantt of the KDiagram library used by other KDE applications (e.g. Calligra and KMyMoney)[1].
Features
Hovedpunkter
- Let at anvende
- Alle standardværdier er relative til vinduets størrelse
- Alle parametre kan redigeres efter, at diagrammet er tegnet
- Valgmuligheder for placering af forklaring
- Skrifttypen i sidehoved og sidefod kan defineres uafhængigt af andre skrifttyper

- Mange diagramtyper
- Søjle: normale | stablede | procent, 2D | 3D-udseende
- Line: normale | stablede| procent, line markers
- Area: normale | stablede | procent
- HøjLav: normale | åben-lukket
- Boksplot
- Cirkel (Lagkage): normale | adskildt, 2D | 3D
- Krans
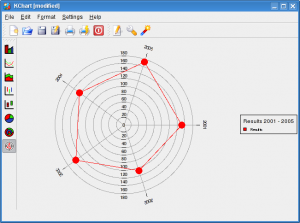
- Polær (Radar): normale | stablede | procent
