KDevelop4/Manual/Working with source code: Difference between revisions
| Line 75: | Line 75: | ||
==== File scope information ==== | ==== File scope information ==== | ||
The next level up is to obtain information about the entire source file you are currently working on. | The next level up is to obtain information about the entire source file you are currently working on. To this end, position the cursor at file scope in the current file and look at the what the "Code browser" tool view shows: | ||
[[image:kdevelop-16.png|thumb|600px|center]] | |||
Here, it shows a list of namespaces, classes and functions declared or defined in the current file, giving you an overview of what's happening in this file and a means to jump directly to any of these declarations or definitions without scrolling up and down in the file or searching for a particular symbol. | |||
{{Note|1=The information shown for file scope is the same as presented in the "Outline" mode discussed below for navigating source code; the difference is that outline mode is only a temporary tooltip.}} | |||
==== Project scope information ==== | |||
There are many ways to obtain information about an entire project (or, in fact, about all projects in a session). This sort of information is typically provided through various tool views. For example, the "Classes" tool view provides a tree structure of all classes and surrounding namespaces for all projects in a session, together with the member functions and variables of each of these classes: | |||
[[image:kdevelop-17.png|thumb|600px|center]] | |||
Hovering over an entry provides again information about the symbol, its location of declaration and definition, and its uses. Double-clicking on an entry in this tree view opens an editor window at the location where the symbol is declared or defined. | |||
But there are other ways of looking at global information. For example, the "Documents" tool provides a view of a project in terms of the kinds of files or other documents this project is comprised of: | |||
[[image:kdevelop-18.png|thumb|600px|center]] | |||
=== Navigating in source code === | === Navigating in source code === | ||
Revision as of 01:04, 22 May 2011
Working with source code
Besides debugging, reading through and writing source code is what you will spend the most time with when developing software. To this end, KDevelop offers you many many different ways to explore source codes and to make writing it more productive. As discussed in more detail in the following sections, KDevelop is not just a source editor — rather, it is a source management system that gives you different views of extracted information on the files that collectively make up your session's source code.
Tools and views
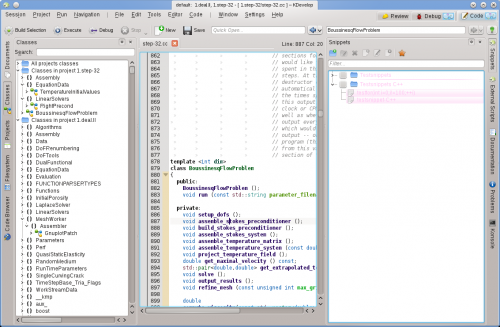
In order to work with projects, KDevelop has the concept of tools. A tool provides a particular view of the source, or an action that can be taken with it. Tools are represented by buttons around the perimeter of your window (in vertical text along the left and right margins, or horizontally along the bottom margin). If you click on them, they expand to a subwindow — a view — within the main window; if you click on the tool button again, the subwindow disappears again.
The picture above shows a particular selection of tools, aligned on the left and right margins; in the picture, the tool is open on the left and the tool on the right, along with an editor for a source file in the middle. In practice, most of the time you will probably only have the editor and maybe the or tool open at the left. Other tool view will likely only be open temporarily as you use the tool, leaving more space for the editor most of the time.
When you run KDevelop the first time, you should already have the tool button. Click on it: it will open a subwindow that shows the projects you have added to the session at the bottom, and a file system view of the directories of your projects at the top.
There are many other tools you can use with KDevelop, not all of which are initially present as buttons on the perimeter. To add some, go to the menu entry. Here are some that you will likely find useful:
- Classes: A complete list of all classes that are defined in one of the projects or your session with all of their member functions and variables. Clicking on any of the members opens a source editor window at the location of the item you clicked on.
- Documents: Lists some of the more recently visited files, by kind (e.g. source files, patch files, plain text documents).
- Code Browser: Depending on your cursor position in a file, this tool shows things that are related. For example, if you are on an
#includeline, it shows information about the file you are including such as what classes are declared in that file; if you are on an empty line at file scope, it shows the classes and functions declared and defined in the current file (all as links: clicking on them brings you to the point in the file where the declaration or definition actually is); if you are in a function definition, it shows where the declaration is and offers a list of places where the function is used. - File system: Shows you a tree view of the file system.
- Documentation: Allows you to search for man pages and other help documents.
- Snippets: This provides sequences of text that one uses over an over and doesn't want to write every time. For example, in the project from which the picture above was created, there is a frequent need to write code like
for (typename Triangulation<dim>::active_cell_iterator cell = triangulation.begin_active(); cell != triangulation.end(); ++cell)
This is an awkward expression but it will look almost exactly like this everytime you need such a loop — which would make it a good candidate for a snippet. - Konsole: Opens a command line window inside KDevelop's main window, for the occasional command you may want to enter (e.g. to run
./configure).
A complete list of tools and views is given here.
For many programmers, vertical screen space is the most important. To this end, you can arrange your tool views at the left and right margin of the window: to move a tool, click on its symbol with the right mouse button and select a new position for it.
Exploring source code
Local information
KDevelop understands source code, and as a consequence it is really good at providing you information about variables or functions that may appear in your program. For example, here is a snapshot of working with a piece of code and hovering the mouse over the symbol cell in line 1316 (if you are working keyboard oriented, you can achieve the same effect by holding down the ALT for a while):
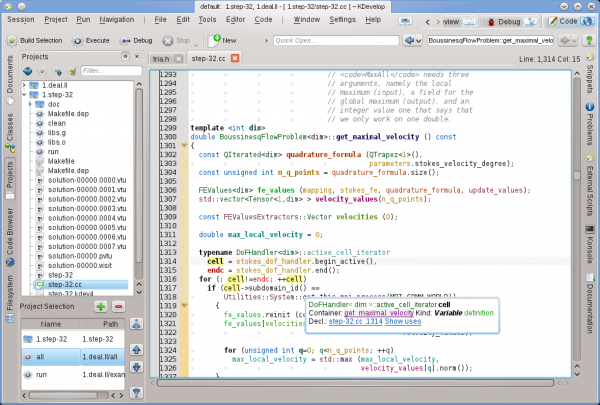
KDevelop shows me a tooltip that includes the type of the variable (here: DoFHandler<dim&rt;active_cell_iterator), where this variable is declared (the container, which here is the surrounding function get_maximal_velocity since it is a local variable), what it is (a variable, not a function, class or namespace) and where it is declared (in line 1314, just a few lines up in the code).
In the current context, the symbol over which the mouse was hovering has no associated documentation. In this example, had the mouse hovered over the symbol get_this_mpi_process in line 1318, the outcome would have been this:
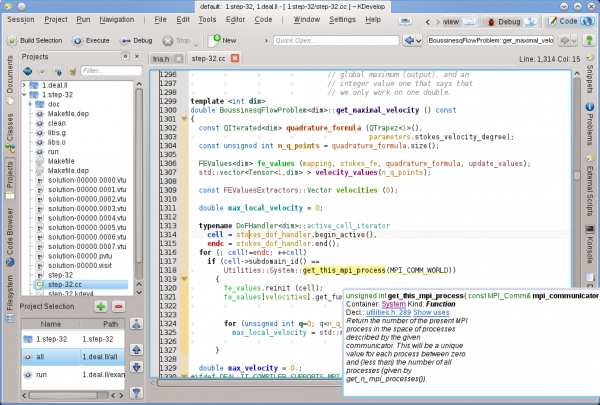
Here, KDevelop has cross-referenced the declaration from an entirely different file (utilities.h, which in fact even resides in a different project of the same session) together with the doxygen-style comment that accompanies the declaration there.
What makes these tooltips even more useful is that they are dynamic: I can click on the container to get information about the context in which the variable is declared (i.e. about the namespace System, such as where it is declared, defined, used, or what its documentation is) and I can click on the blue links that will reset the cursor position to the location of the declaration of the Symbol (e.g. in utilities.h, line 289) or give me a list of places where this symbol is used in the current file or throughout all the projects of the current session. The latter is often useful if you want to explore how, for example, a particular function is used in a large code basis.
File scope information
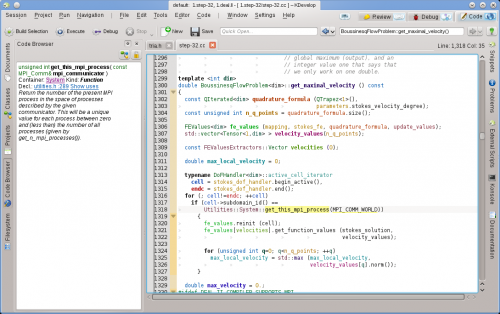
The next level up is to obtain information about the entire source file you are currently working on. To this end, position the cursor at file scope in the current file and look at the what the "Code browser" tool view shows:
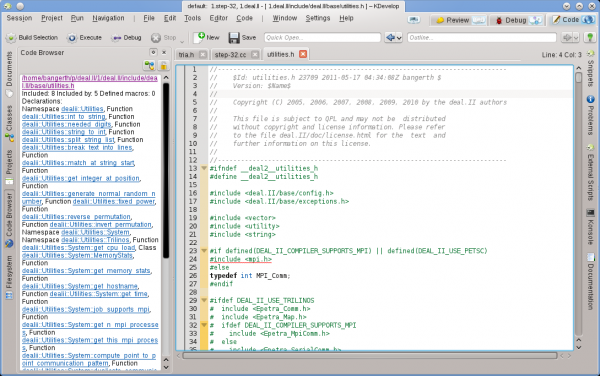
Here, it shows a list of namespaces, classes and functions declared or defined in the current file, giving you an overview of what's happening in this file and a means to jump directly to any of these declarations or definitions without scrolling up and down in the file or searching for a particular symbol.
Project scope information
There are many ways to obtain information about an entire project (or, in fact, about all projects in a session). This sort of information is typically provided through various tool views. For example, the "Classes" tool view provides a tree structure of all classes and surrounding namespaces for all projects in a session, together with the member functions and variables of each of these classes:
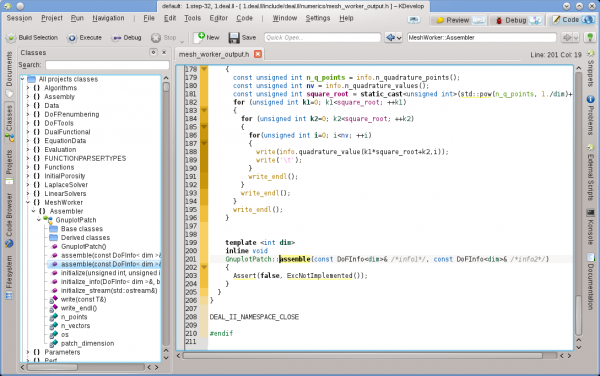
Hovering over an entry provides again information about the symbol, its location of declaration and definition, and its uses. Double-clicking on an entry in this tree view opens an editor window at the location where the symbol is declared or defined.
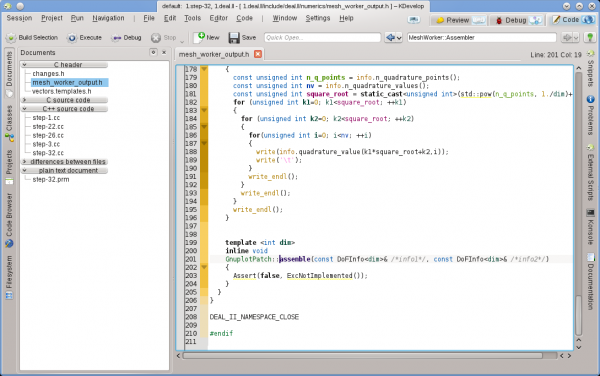
But there are other ways of looking at global information. For example, the "Documents" tool provides a view of a project in terms of the kinds of files or other documents this project is comprised of:
Modes and working sets

If you've gotten this far, take a look at the upper right of the KDevelop main window: As shown in the picture, you will see that there are three modes KDevelop can be in: (the mode we discuss in the current chapter on working with source code), (see Debugging programs) and (see Working with version control systems).
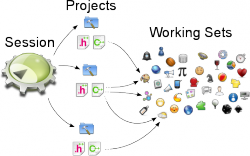
Each mode has its own set of tools that are stacked around the perimeter, and each mode also has a working set of currently open files and documents. Furthermore, each such working set is associated with a current session, i.e. we have the relationship shown above. Note that the files in the working set come from the same session, but they may come from different projects that are part of the same session.
If you open KDevelop the first time, the working set is empty — there are no open files. But as you open files for editing (or debugging, or reviewing in the other modes) your working set grows. The fact that your working set is non-empty is indicated by a symbol in the tab, as shown below. You will notice that whenever you close KDevelop and later start it again, the working set is saved and restored, i.e. you get the same set of open files.
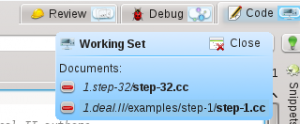
If you hover your mouse over the symbol for the working set, you get a tooltip that shows you which files are currently open in this working set (here: the step-32.cc and step-1.cc files). Clicking on the red minus sign closes the tab for the corresponding file. Maybe more importantly, clicking on the correspondingly named button allows you to close the entire working set at once (i.e. to close all currently open files). The point about closing a working set, however, is that it doesn't just close all files, it actually saves the working set and opens a new, still empty one. You can see this here:

Note the two symbols to the left of the three mode tabs (the heart and the unidentifiable symbol to its left). Each of these two symbols represents a saved working set, in addition to the currently open working set. If you hover your mouse over the heart symbol, you'll get something like this:

It shows you that the corresponding working set contains two files and their corresponding project names: Makefile and changes.h. Clicking will close and save the current working set (which as shown here has the files tria.h and tria.cc open) and instead open the selected working set. You can also permanently delete a working set, which removes it from the set of saved working sets.
Some useful keyboard shortcuts
KDevelop's editor follows the standard keyboard shortcuts for all usual editing operations. However, it also supports a number of more advanced operations when editing source code, some of which are bound to particular key combinations. The following are frequently particularly helpful:
| Jumping around in code | |
|---|---|
| Ctrl+Alt+O | Quick open file: enter part of a filename and select among all the files in the current session's projects' directory trees that match the string; the file will then be opened |
| Ctrl+Alt+C | Quick open class: enter part of a class name and select among all class names that match; the cursor will then jump to the class declaration |
| Ctrl+Alt+M | Quick open function: enter part of a (member) function name and select among all names that match; note that the list shows both declarations and definitions and the cursor will then jump to the selected item |
| Ctrl+Alt+Q | Universal quick open: type anything (file name, class name, function name) and get a list of anything that matches to select from |
| Ctrl+Alt+N | Outline: Provide a list of all things that are happening in this file, e.g. class declarations and function definitions |
| Ctrl+, | Jump to definition of a function if the cursor is currently on a function declaration |
| Ctrl+. | Jump to declaration of a function or variable if the cursor is currently in a function definition |
| Ctrl+Alt+PageDown | Jump to next function |
| Ctrl+Alt+PageUp | Jump to previous function |
| Ctrl+G | Goto line |
| Searching and replacing | |
| Ctrl+F | Find |
| F3 | Find next |
| Ctrl+R | Replace |
| Ctrl+Alt+F | Find-Replace in multiple files |
| Other things | |
| Ctrl+_ | Collapse one level: remove this block from view, for example if you want to focus on the bigger picture within a function |
| Ctrl++ | Expand one level: undo the collapsing |
| Ctrl+D | Comment out selected text or current line |
| Ctrl+Shift+D | Comment in selected text or current line |
| Alt+Shift+D | Document the current function. If the cursor is on a function or class declaration then hitting this key will create a doxygen-style comment pre-populated with a listing of all parameters, return values, etc. |
| Ctrl+T | Transpose the current and the previous character |
| Ctrl+K | Delete the current line (note: this is not just emacs' "delete from here to the end of the line") |


