Kdenlive/Manual/View Menu/Audio Spectrum: Difference between revisions
m (add translation tags) |
|||
| Line 1: | Line 1: | ||
<languages/> | |||
<translate> | |||
====Audio Spectrum ==== | ====Audio Spectrum ==== | ||
| Line 20: | Line 22: | ||
[[Category:Kdenlive]] | [[Category:Kdenlive]] | ||
</translate> | |||
Revision as of 06:51, 11 January 2014
Audio Spectrum
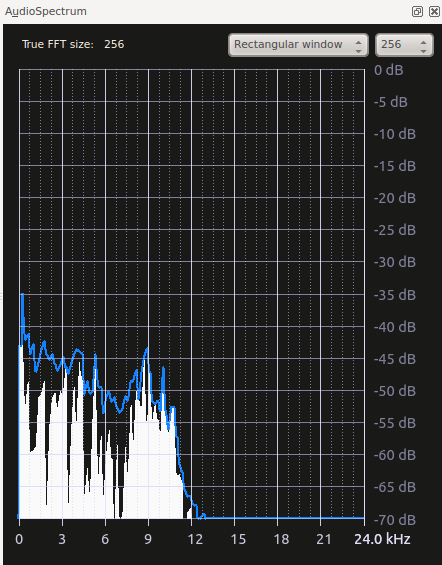
This allows you to monitor the audio properties of your clip in detail. The graph only display data while the clip is playing in the clip or project monitor.
It graphs the loudness of the audio (in decibels - vertical axis) for each audio frequency (horizontal axis) in the current frame. The blue curve is +- the maximum over the previous few samples.
See also Spectrogram scope which displays a graphical representation of the audio spectrum over the entire clip.
For more information see Granjow's blog on Audio Spectrum

