KmPlot/Using Sliders
A main feature of KmPlot is to visualize the influence of parameters to the curve of a function.
Moving a Sinus Curve
Let's see, how to move a sinus curve left and right:
- Create a new Cartesian plot.
- Enter the equation
f(x,a) = sin(x-a)
- Check the option and choose from the drop down list.
- To make the available sliders visible, check
Now you can move the slider and see how the parameter value modifies the position of the curve.
- Screenshots
-
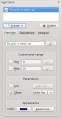
Input
-
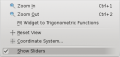
Show sliders option
-
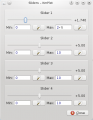
Slider window


Trajectory of a Projectile
Now let's have a look at the maximum distance of a projectile thrown with different angles. We use a parametric plot depending on an additional parameter which is the angle.
- Define a constant v_0 for the starting velocity.
- Create a new parametric plot
- Enter the equations
f_x(t,α) = v_0∙cos(α)∙t
f_y(t,α) = 2+v_0∙sin(α)∙t−5∙t^2
- Check the option and choose from the drop down list.
- To make the available sliders visible, check
Now you can move the slider and see how the distance depends on the parameter value.
