KmPlot/Brug af skydere
En vigtig funktion i KmPlot er at visualisere parametres betydning for en funktions graf.
Bevæg en sinuskurve
Lad os se, hvordan man kan bevæge en sinuskurve til venstre og højre:
- Lav et Cartesisk plot.
- Skriv ligningen
f(x,a) = sin(x-a)
- Markér tilvalget og vælg fra dropnedfeltet.
- For at gøre de tilgængelige skydere synlige, så vælg menuen
Nu kan du trække skyderen frem og tilbage og se, hvordan parameterværdien påvirker kurvens position.
- Screenshots
-
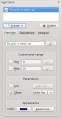
Input
-
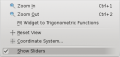
Menuen Vis skydere
-
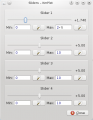
Skydervinduet


Et projektils bane
Now let's have a look at the maximum distance of a projectile thrown with different angles. We use a parametric plot depending on an additional parameter which is the angle.
- Define a constant v_0 for the starting velocity.
- Create a new parametric plot
- Enter the equations
f_x(t,α) = v_0∙cos(α)∙t
f_y(t,α) = 2+v_0∙sin(α)∙t−5∙t^2
- Check the option and choose from the drop down list.
- To make the available sliders visible, check
Now you can move the slider and see how the distance depends on the parameter value.
