KmPlot/Using Sliders/de: Difference between revisions
Pipesmoker (talk | contribs) (Created page with "==Verschieben der Sinuskurve==") |
Pipesmoker (talk | contribs) (Created page with "Lass uns die Sinuskurve nach links und rechts verschieben:") |
||
| Line 4: | Line 4: | ||
==Verschieben der Sinuskurve== | ==Verschieben der Sinuskurve== | ||
Lass uns die Sinuskurve nach links und rechts verschieben: | |||
* Create a new cartesian plot. | * Create a new cartesian plot. | ||
Revision as of 17:53, 11 October 2010
Ein besonderes Merkmal von KmPlot ist die Veranschaulichung der Wirkung eines Parameters auf den Kurvernverlauf einer Funktion.
Verschieben der Sinuskurve
Lass uns die Sinuskurve nach links und rechts verschieben:
- Create a new cartesian plot.
- Enter the equation
f(x,a) = sin(x-a)
- Check the option and choose from the drop down list.
- To make the available sliders visible, check
Now you can move the slider and see how the parameter value modifies the position of the curve.
- Screenshots
-
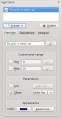
Input
-
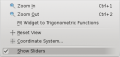
Show sliders option
-
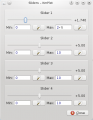
Slider window


Trajectory of a Projectile
Now let's have a look at the maximum distance of a projectile thrown with different angles. We use a parametric plot depending on an additional parameter which is the angle.
- Define a contant v_0 for the starting velocity.
- Create a new parametric plot
- Enter the equations
f_x(t,α) = v_0∙cos(α)∙t
f_y(t,α) = 2+v_0∙sin(α)∙t−5∙t^2
- Check the option and choose from the drop down list.
- To make the available sliders visible, check
Now you can move the slider and see how the distance depends on the parameter value.
