KmPlot/Using Sliders/uk: Difference between revisions
(Created page with "Давайте навчимося пересувати графік синуса ліворуч і праворуч:") |
(Created page with "* Створіть новий графік у прямокутній декартовій системі координат.
* Введіть рівняння кривої {{Inp...") |
||
| Line 6: | Line 6: | ||
Давайте навчимося пересувати графік синуса ліворуч і праворуч: | Давайте навчимося пересувати графік синуса ліворуч і праворуч: | ||
* | * Створіть новий графік у прямокутній декартовій системі координат. | ||
* | * Введіть рівняння кривої {{Input|1=f(x,a) = sin(x-a)}} | ||
* | * Позначте пункт <menuchoice>Повзунок</menuchoice> і виберіть <menuchoice>Повзунок No. 1</menuchoice> зі спадного списку. | ||
* | * Щоб зробити повзунки видимими, позначте пункт <menuchoice>Перегляд -> Показати повзунки</menuchoice> | ||
Now you can move the slider and see how the parameter value modifies the position of the curve. | Now you can move the slider and see how the parameter value modifies the position of the curve. | ||
Revision as of 18:13, 11 October 2010
Однією з основних можливостей KmPlot є можливість візуалізації впливу параметрів на графік функції.
Пересування графіка синуса
Давайте навчимося пересувати графік синуса ліворуч і праворуч:
- Створіть новий графік у прямокутній декартовій системі координат.
- Введіть рівняння кривої
f(x,a) = sin(x-a)
- Позначте пункт і виберіть зі спадного списку.
- Щоб зробити повзунки видимими, позначте пункт
Now you can move the slider and see how the parameter value modifies the position of the curve.
- Screenshots
-
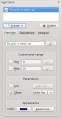
Input
-
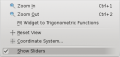
Show sliders option
-
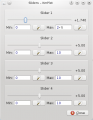
Slider window


Trajectory of a Projectile
Now let's have a look at the maximum distance of a projectile thrown with different angles. We use a parametric plot depending on an additional parameter which is the angle.
- Define a contant v_0 for the starting velocity.
- Create a new parametric plot
- Enter the equations
f_x(t,α) = v_0∙cos(α)∙t
f_y(t,α) = 2+v_0∙sin(α)∙t−5∙t^2
- Check the option and choose from the drop down list.
- To make the available sliders visible, check
Now you can move the slider and see how the distance depends on the parameter value.
