LabPlot: Difference between revisions
No edit summary |
|||
| (5 intermediate revisions by 2 users not shown) | |||
| Line 26: | Line 26: | ||
More screenshots can be viewed at [https://labplot.kde.org/gallery/ LabPlot webpage]. | More screenshots can be viewed at [https://labplot.kde.org/gallery/ LabPlot webpage]. | ||
== Documentation == | == Documentation == <!--T:12--> | ||
* [[Special:myLanguage/LabPlot/ | * [[Special:myLanguage/LabPlot/GettingStarted|Getting Started]] | ||
* [[Special:myLanguage/LabPlot/UserGuide|User Guide]] | * [[Special:myLanguage/LabPlot/UserGuide|User Guide]] | ||
* [[Special:myLanguage/LabPlot/Tutorials|Tutorials]] | * [[Special:myLanguage/LabPlot/Tutorials|Tutorials and HOWTOs]] | ||
* [[Special:myLanguage/LabPlot/FAQ|FAQ]] | * [[Special:myLanguage/LabPlot/FAQ|FAQ]] | ||
| Line 35: | Line 35: | ||
<!--T:10--> | <!--T:10--> | ||
* [https://labplot.kde.org LabPlot | * [https://labplot.kde.org Homepage] | ||
* [https:// | * [https://twitter.com/LabPlot Twitter] | ||
* [https://floss.social/@LabPlot Mastodon] | |||
* [https://www.youtube.com/@labplot YouTube] | |||
* Wikipedia (en) | |||
** [https://en.wikipedia.org/wiki/LabPlot Main article] | |||
** [https://en.wikipedia.org/wiki/List_of_information_graphics_software List of information graphics software] | |||
** [https://en.wikipedia.org/wiki/Comparison_of_numerical-analysis_software Comparison of numerical-analysis software] | |||
* To cite LabPlot in publications use (see also [https://guides.libraries.uc.edu/citing/code "Citing computer code in a report or paper"]): | |||
<source> | |||
LabPlot Team (2022), LabPlot: A FREE, open source, cross-platform Data Visualization and Analysis software accessible to everyone, | |||
(Version 2.9) [Computer software]. https://labplot.kde.org. | |||
</source> | |||
<!--T:4--> | <!--T:4--> | ||
[[Category:Science]] | [[Category:Science]] | ||
</translate> | </translate> | ||
Latest revision as of 07:11, 22 March 2023

|
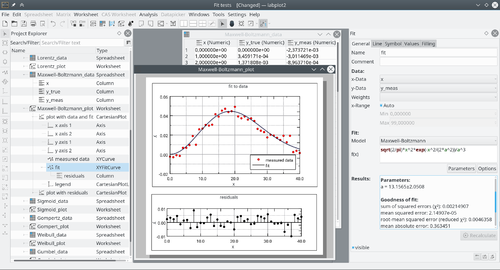
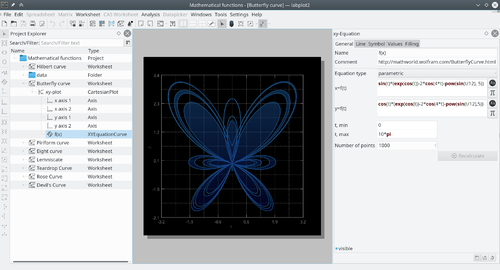
LabPlot is an application for interactive graphing and analysis of scientific data. LabPlot provides an easy way to create, manage and edit plots and to perform data analysis. |
Introduction
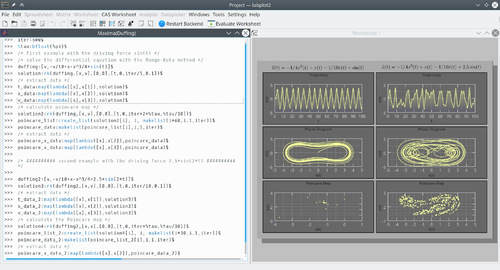
LabPlot supports 2D-plotting, data analysis (e.g Fourier transformation, Linear and non-linear regression analysis), computing with computer algebra systems (CAS) like Maxima and GNU Octave and importing and exporting to many formats.
A complete list of LabPlot features is available in LabPlot webpage.
Screenshots


More screenshots can be viewed at LabPlot webpage.
Documentation
More Information
- Homepage
- Mastodon
- YouTube
- Wikipedia (en)
- To cite LabPlot in publications use (see also "Citing computer code in a report or paper"):
      LabPlot Team (2022), LabPlot: A FREE, open source, cross-platform Data Visualization and Analysis software accessible to everyone,
      (Version  2.9) [Computer software]. https://labplot.kde.org.