LabPlot/bn: Difference between revisions
(Created page with "ল্যাবপ্লট") |
(Created page with "{|class="tablecenter vertical-centered" | 64px | '''ল্যাবপ্লট''' বৈজ্ঞানিক তথ্যের ইন্টারেক্টিভ গ্রাফিং এবং বিশ্লেষণের জন্য একটি অ্যাপ্লিকেশন। '''ল্যাবপ্লট''' প্লট তৈরি, পরিচালনা ও সম্পাদনা করার এবং উপাত্ত...") |
||
| Line 3: | Line 3: | ||
{|class="tablecenter vertical-centered" | {|class="tablecenter vertical-centered" | ||
| [[Image:LabPlot.png|64px]] | | [[Image:LabPlot.png|64px]] | ||
| ''' | | '''ল্যাবপ্লট''' বৈজ্ঞানিক তথ্যের ইন্টারেক্টিভ গ্রাফিং এবং বিশ্লেষণের জন্য একটি অ্যাপ্লিকেশন। '''ল্যাবপ্লট''' প্লট তৈরি, পরিচালনা ও সম্পাদনা করার এবং উপাত্ত বিশ্লেষণ করার একটি সহজ উপায় প্রদান করে। | ||
|} | |} | ||
== | <span id="Introduction"></span> | ||
== ভূমিকা == | |||
'''LabPlot''' supports 2D-plotting, data analysis (e.g Fourier transformation, Linear and non-linear regression analysis), computing with computer algebra systems (CAS) like [https://en.wikipedia.org/wiki/Maxima_(software) Maxima] and [https://en.wikipedia.org/wiki/GNU_Octave GNU Octave] and importing and exporting to many formats. | '''LabPlot''' supports 2D-plotting, data analysis (e.g Fourier transformation, Linear and non-linear regression analysis), computing with computer algebra systems (CAS) like [https://en.wikipedia.org/wiki/Maxima_(software) Maxima] and [https://en.wikipedia.org/wiki/GNU_Octave GNU Octave] and importing and exporting to many formats. | ||
Revision as of 19:38, 14 November 2023

|
ল্যাবপ্লট বৈজ্ঞানিক তথ্যের ইন্টারেক্টিভ গ্রাফিং এবং বিশ্লেষণের জন্য একটি অ্যাপ্লিকেশন। ল্যাবপ্লট প্লট তৈরি, পরিচালনা ও সম্পাদনা করার এবং উপাত্ত বিশ্লেষণ করার একটি সহজ উপায় প্রদান করে। |
ভূমিকা
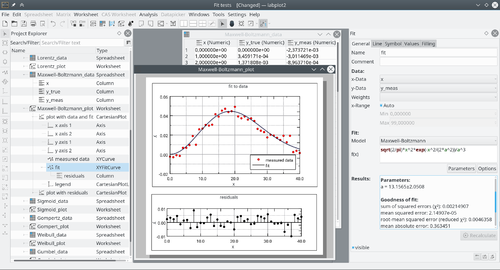
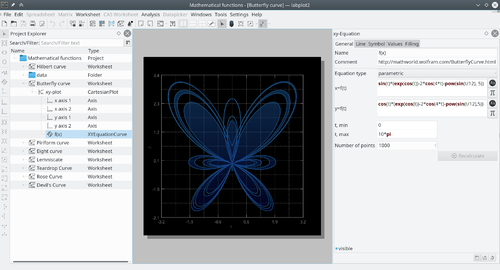
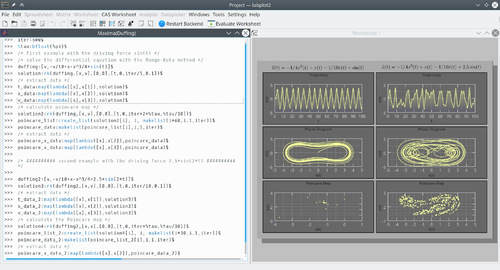
LabPlot supports 2D-plotting, data analysis (e.g Fourier transformation, Linear and non-linear regression analysis), computing with computer algebra systems (CAS) like Maxima and GNU Octave and importing and exporting to many formats.
A complete list of LabPlot features is available in LabPlot webpage.
Screenshots


More screenshots can be viewed at LabPlot webpage.
Documentation
More Information
- Homepage
- Mastodon
- YouTube
- Wikipedia (en)
- To cite LabPlot in publications use (see also "Citing computer code in a report or paper"):
      LabPlot Team (2022), LabPlot: A FREE, open source, cross-platform Data Visualization and Analysis software accessible to everyone,
      (Version  2.9) [Computer software]. https://labplot.kde.org.