|
|
| Line 5: |
Line 5: |
|
| |
|
| This tutorial is written using kplato release 0.9.84 working on a kubuntu installation 10.10 with KDE 4.5.1. Language used is english. | | This tutorial is written using kplato release 0.9.84 working on a kubuntu installation 10.10 with KDE 4.5.1. Language used is english. |
|
| |
| = Planning phase =
| |
| == Starting ==
| |
| When you open the program for the first time, the below window will appear.
| |
|
| |
| We choose the 8hours day, 40 days per week template to start
| |
|
| |
| <center>[[Image:open_project.png|800px]]</center>
| |
|
| |
| === Main project setting ===
| |
| Then we give the project a name and a manager, and set some other general information. To do this you need to click on the "edit main project" icon on the top left of the screen and then the following window will appear.
| |
|
| |
|
| |
| <center>[[Image:proj_set1.png|400px]]</center>
| |
|
| |
|
| |
| On this window we can write the name of the project, choose a manager from a list already present in the system (if you have KDE and Kontact) or write a new name as per your convenience.
| |
|
| |
| The target times Earliest start and Latest finish is used when scheduling the project. We want to schedule forward, so we set earliest start to when we want the project to start, and the latest finish we set to the latest time the project should finish. If the project cannot be scheduled to finish before this time, a scheduling warning is given.
| |
|
| |
| At the bottom of the window can be inserted a comment on the project. These data will be used for the reports or for other general purposes during the working period.
| |
|
| |
|
| |
| '''''Remember to press CTRL+S to save the file sometime!!Kplato regularly updates a backup file in case it crashes'''''
| |
|
| |
|
| |
| === Currency setting ===
| |
| We can choose to work in different currency. As the english is set to $, we need to change to €. To do so, we need to select the menu "Tools->Define Currency" and the below window will appear.
| |
|
| |
|
| |
| <center>[[Image:proj_curr.png|400px]]</center>
| |
|
| |
|
| |
| Then, change the currency symbol from $ to € and click ok as the other features are ok.
| |
|
| |
| == Work calendar ==
| |
| Have a look at the work & vacation calendar, on the upper part of the left window view selector under the Editors group. Following what will appear:
| |
|
| |
|
| |
| <center>[[Image:work1.png|800px]]</center>
| |
|
| |
|
| |
| In the centre we can add different calendars for different time zone and week effort. On the right there's a month calendar, on it's upper part, there's the configuration for the working week hours, typically 8 hours from Monday to Friday and non working days for Saturday and Sunday.
| |
|
| |
|
| |
| Let's add a new calendar for our future purposes clicking on the "add calendar" icon, than for the name we write "installation" and for the time zone we choose "Asia/Ho_chi_minh" from the selecting men
| |
|
| |
|
| |
| <center>[[Image:work3.png|500px]]</center>
| |
|
| |
|
| |
| We now selecting the installation calendar and define the relative working week.
| |
|
| |
| On the right upper corner of the calendar, there are some spaces indicating a typical working week.
| |
|
| |
| <center>[[Image:work_vacation3.png|400px]]</center>
| |
|
| |
|
| |
| Right click on the blank one below the Monday indication and a menu will appear with the possibility to choose between Work, Non Working and Undefined.
| |
|
| |
| Click on work and the following window will appear
| |
|
| |
|
| |
| <center>[[Image:work_vacation4.png|400px]]</center>
| |
|
| |
| We add typical working hours for installation work. 10 hours per day from Monday to Saturday and 4 hours on Sunday. In case needed we can also choose to insert the pause time.
| |
|
| |
| So, starting from 7 am for 10 hours and then click "add" and then "ok".
| |
|
| |
| Repeat the same for the other days up to Saturday while for Sunday insert 4 hours from 8 in the morning.
| |
|
| |
| You can also select multiple days or weekdays by using Shift-LMB or Ctrl- LMB
| |
|
| |
|
| |
| We can also right click on a date in the calendar and doing the same considerations about the working and non working days or time. This is especially needed when you need to work with different holidays from yours!
| |
|
| |
|
| |
| Anyhow, the final result should be like the below image.
| |
|
| |
|
| |
| <center>[[Image:work2.png|800px]]</center>
| |
|
| |
| == Cost breakdown structure ==
| |
| Here we define which will be the cost centres we wish to use in the project. We can have different group and subgroup.
| |
|
| |
| Click on the "cost breakdown structure" item on the left side of the window, just under the work and vacation item you pressed before.
| |
|
| |
| As per costs managing needs we divide the structures of the costs in the following way
| |
|
| |
| <center>[[Image:cbs1.png|800px]]</center>
| |
|
| |
| play with the "add account" and "add subaccount" icons to reach the full tree! This is a personal approach for a complete ETO project due to my experience.
| |
|
| |
| For example you can have a "direct employee" account to manage the cost for your employee, or to have an idea about the cost of your suppliers using a dedicated account as soon as you insert their work.
| |
|
| |
| == Resources ==
| |
| So, now it's time to define our team and the material!!
| |
|
| |
| You can access to the resources window clicking on the "resource" item on the left side of the window, just under the cost breakdown structure item pressed before.
| |
|
| |
| The resources are organized as "resource groups" and "resources". So, first we insert the team group as resource group clicking on the "Add Resource group" icon for each item as below.
| |
|
| |
| <center>[[Image:res6.png|400px]]</center>
| |
|
| |
| As soon as you complete the group it's time to insert the people and the materials!
| |
|
| |
| <center>[[Image:res1.png|800px]]</center>
| |
|
| |
| === Work Resources ===
| |
| Now it's time to edit each single resource for the purpose to define it. Right click on the resource name to open the "resource setting" window.
| |
|
| |
| <center>[[Image:res2.png|300px]]</center>
| |
|
| |
| Therefore we add the initials and the email address, switch the calendar to "base" calendar, insert the cost as per need. The account is set to "none" as in this case we do not charge the cost to a specific cost account.
| |
|
| |
|
| |
| '''''TIP! Instead to right click each item, we can change directly on the main window clicking on each characteristics we wish to change'''''
| |
|
| |
|
| |
| remember that for the installation resources there will be a different calendar, the "installation", that we inserted before!
| |
|
| |
|
| |
| '''''TIP! as entering resource characteristics is a long work that probably is needed for other project, It might be better to maintain you resources in a separate file and insert them when you start a new project using Tools->Insert Project File. This will preserve the (internal) identity of the resources which may come in handy if you want to coordinate multiple projects later. See http://userbase.kde.org/KPlato/Manual/Managing_Resources'''''
| |
|
| |
| === Material Resources ===
| |
| We decided to add the workshop machines to consider some costs as well as their use.
| |
|
| |
| For this purpose in the resource we add the workshop as a material and a CNC machine as well as assembly tools package.
| |
|
| |
| <center>[[Image:res4.png|300px]]</center>
| |
|
| |
| '''''It is important to insert these sub group materials in a “material” group otherwise they cannot be used in the “required resources” selection with the work in the resource setting as well as they cannot be selected in the “Task setting - Resources”. See the below images.'''''
| |
|
| |
| <center>[[Image:res3.png|300px]]</center>
| |
|
| |
| <center>[[Image:res7.png|400px]]</center>
| |
|
| |
| === Calendar preference ===
| |
| One other interesting thing to note is that we use different calendars for different resources.
| |
|
| |
| <center>[[Image:res5.png|300px]]</center>
| |
|
| |
| The calendar on the task has the precedence on the resource's calendar. The availability date for a resource largely depend if this resource is available only for a period of time. In this case we need to be sure that all the resources are available from the beginning to the end of the job.
| |
|
| |
| Overtime rate is not yet implemented.
| |
|
| |
| == Task ==
| |
| Now it's tasks time !!!!
| |
|
| |
| You can access the task window clicking on the "task" item on the left side of the window, just under the resource item you pressed before.
| |
|
| |
| We have to insert the following items:
| |
|
| |
|
| |
| <center>[[Image:task1.png|800px]]</center>
| |
|
| |
| As we inserted the each name, we can edit each item right clicking the name. The following will appear on the first task:
| |
|
| |
| <center>[[Image:task2.png|400px]]</center>
| |
|
| |
|
| |
| There are five tabs: general, resources, documents, cost, description.
| |
|
| |
| On the General tab insert the name of the task, can choose a responsible if needed, than define the timing and the risk associated to the task. The schedule type is typical for planning, "as soon as possible" is the most used. Other kind of type, generate a need to compile the date and time on the right of the drop-down menu.
| |
|
| |
| The estimate is the time required to complete the task, can be in different units: h (hours), d (days), w (weeks) and M (months).
| |
|
| |
| The estimation can be in effort or duration. Effort is the need of working time for a task, Duration is the working duration for a task. The main difference is that for an effort if you use two workers, the total time will be cutted by two! If you have duration, the total time will be the same even if you use more workers. This implicity impact the cost for the task.
| |
|
| |
| The risk level as well as the optimistic and pessimistic timing will impact the calculation of the total project considering the PERT technique. In this case -5% and 20% are the value as well as the risk is considered "High".
| |
|
| |
|
| |
| <center>[[Image:task3.png|400px]]</center>
| |
|
| |
|
| |
| On the resource tab, we choose the desired resource to be used as well as it's availability in % and eventual resources associated.
| |
|
| |
|
| |
| <center>[[Image:task4.png|400px]]</center>
| |
|
| |
|
| |
| in the document tab we can link documents pertaining to the task. Not used for our tutorial
| |
|
| |
|
| |
| <center>[[Image:task5.png|400px]]</center>
| |
|
| |
|
| |
| The fourth tab is the cost tab. Here we can associate the running cost of the task to an account previously defined into the "cost breakdown structure".
| |
|
| |
| We can also choose to add startup and shutdown cost for the task, that can be associated to different account.
| |
|
| |
|
| |
| '''''Note that the startup and shutdown cost are integrated into the BCWS'''''
| |
|
| |
|
| |
| <center>[[Image:task6.png|400px]]</center>
| |
|
| |
|
| |
| The last tab is the description tab where we can insert our comments, mainly the list of the deliverables related to the task.
| |
|
| |
| == Dependancies ==
| |
| Now it's time to prioritize the activities! Let's click on the "dependancies (graphics)" item on the left side of the main window.
| |
|
| |
| So this is what should appear as soon as you open the right window.
| |
|
| |
|
| |
| <center>[[Image:kplato_dep1.png|800px]]</center>
| |
|
| |
| Let's start to give priority at the tasks in order to obtain a full list of dependencies. This can be done graphically with the mouse, clicking at the right or left side of the task and then drag the relative arrow to the desired position of the other task. Should be better to connect only the tasks and not the summary. Result should be like below.
| |
|
| |
| <center>[[Image:kplato_dep3.png|800px]]</center>
| |
|
| |
| == Schedule ==
| |
| Wow, now it's time for schedule and prepare the baseline for the project!!
| |
|
| |
| clicking on the left menu on the "schedule" will bring you to the schedule activities!
| |
|
| |
| Now we create a new schedule clicking on the button "add schedule" at the top of the window, then we choose a PERT analisys for the distribution type and then we click on "calculate" button. As soon as the calculation is finished, press on "baseline" button on the top of the window. The result will be like this:
| |
|
| |
|
| |
| <center>[[Image:kplato_sched1.png|800px]]</center>
| |
|
| |
| '''''ATTENTION – always check the scheduling log as looking for some errors in the "severity" column could be helpful.'''''
| |
|
| |
|
| |
| here, for reference is a copy from the kplato manual of the field's definitions in the schedule
| |
|
| |
|
| |
|
| |
| {| style="border-spacing:0;"
| |
| | style="background-color:#efefef;border-top:0.035cm solid #808080;border-bottom:0.035cm solid #808080;border-left:0.035cm solid #808080;border-right:none;padding:0.132cm;"| '''Column'''
| |
| | style="background-color:#efefef;border:0.035cm solid #808080;padding:0.132cm;"| '''Description'''
| |
|
| |
| |-
| |
| | style="background-color:transparent;border-top:none;border-bottom:0.035cm solid #808080;border-left:0.035cm solid #808080;border-right:none;padding:0.132cm;"| Name
| |
| | style="background-color:transparent;border-top:none;border-bottom:0.035cm solid #808080;border-left:0.035cm solid #808080;border-right:0.035cm solid #808080;padding:0.132cm;"| The name of the schedule.
| |
|
| |
| |-
| |
| | style="background-color:transparent;border-top:none;border-bottom:0.035cm solid #808080;border-left:0.035cm solid #808080;border-right:none;padding:0.132cm;"| State
| |
| | style="background-color:transparent;border-top:none;border-bottom:0.035cm solid #808080;border-left:0.035cm solid #808080;border-right:0.035cm solid #808080;padding:0.132cm;"| The schedules state. Shows a progress bar during scheduling.
| |
|
| |
| |-
| |
| | style="background-color:transparent;border-top:none;border-bottom:0.035cm solid #808080;border-left:0.035cm solid #808080;border-right:none;padding:0.132cm;"| Direction
| |
| | style="background-color:transparent;border-top:none;border-bottom:0.035cm solid #808080;border-left:0.035cm solid #808080;border-right:0.035cm solid #808080;padding:0.132cm;"| The scheduling direction.
| |
|
| |
| If direction is Forward, the project is scheduled starting at the projects earliest start time specified in the main project dialog. If direction is Backward, the project is scheduled starting at the projects latest finish time specified in the main project dialog."
| |
|
| |
| |-
| |
| | style="background-color:transparent;border-top:none;border-bottom:0.035cm solid #808080;border-left:0.035cm solid #808080;border-right:none;padding:0.132cm;"| Overbooking
| |
| | style="background-color:transparent;border-top:none;border-bottom:0.035cm solid #808080;border-left:0.035cm solid #808080;border-right:0.035cm solid #808080;padding:0.132cm;"| Controls resource overbooking when scheduling.
| |
|
| |
| If overbooking is allowed, a resource may be booked (on working days) to work more than it is available. This can happen if the resource is allocated to multiple tasks or are booked on other projects. If overbooking is to be avoided, resources will not be booked more than they are available. On resource conflict, tasks will be delayed until the resource is available.
| |
|
| |
| |-
| |
| | style="background-color:transparent;border-top:none;border-bottom:0.035cm solid #808080;border-left:0.035cm solid #808080;border-right:none;padding:0.132cm;"| Distribution
| |
| | style="background-color:transparent;border-top:none;border-bottom:0.035cm solid #808080;border-left:0.035cm solid #808080;border-right:0.035cm solid #808080;padding:0.132cm;"| The distribution to be used during scheduling.
| |
|
| |
| If distribution is 'None', the tasks estimate is used as is during scheduling. If distribution is 'PERT', the estimate (E) used is calculated based on the entered optimistic- (O), pessimistic-(P) and most likely (M) estimate. The formula used for this is:
| |
|
| |
| E = (O + 4 * M + P) / 6.
| |
|
| |
| |-
| |
| | style="background-color:transparent;border-top:none;border-bottom:0.035cm solid #808080;border-left:0.035cm solid #808080;border-right:none;padding:0.132cm;"| Planned Start
| |
| | style="background-color:transparent;border-top:none;border-bottom:0.035cm solid #808080;border-left:0.035cm solid #808080;border-right:0.035cm solid #808080;padding:0.132cm;"| The scheduled start time.
| |
|
| |
| |-
| |
| | style="background-color:transparent;border-top:none;border-bottom:0.035cm solid #808080;border-left:0.035cm solid #808080;border-right:none;padding:0.132cm;"| Planned Finish
| |
| | style="background-color:transparent;border-top:none;border-bottom:0.035cm solid #808080;border-left:0.035cm solid #808080;border-right:0.035cm solid #808080;padding:0.132cm;"| The scheduled finish time.
| |
|
| |
| |-
| |
| | style="background-color:transparent;border-top:none;border-bottom:0.035cm solid #808080;border-left:0.035cm solid #808080;border-right:none;padding:0.132cm;"| Scheduler
| |
| | style="background-color:transparent;border-top:none;border-bottom:0.035cm solid #808080;border-left:0.035cm solid #808080;border-right:0.035cm solid #808080;padding:0.132cm;"| The scheduler used for calculating the project schedule.
| |
|
| |
| The default built-in scheduler is the Network Scheduler. Other schedulers presently available is RCPS if libRCPS is installed on your system. RCPS is a genetics based resource constrained project scheduler
| |
|
| |
| |}
| |
| So now we have finished our planning activities for the project!!!!!
| |
|
| |
|
| = Executing and controlling = | | = Executing and controlling = |
General
In this tutorial you will see an Engineering To Order project (ETO), typical for manufacturing companies working on medium machines or plants.
There are two main phases, the first is related to the planning while the second is related to the executing and controlling.
This tutorial is written using kplato release 0.9.84 working on a kubuntu installation 10.10 with KDE 4.5.1. Language used is english.
Executing and controlling
It's time to start our project. After certain time we collect the informations needed as completion percentage, worked hours, expenses.
Gantt chart
Now, as we have the baseline, we have prepared all the data needed for the next step which is controlling the working process! Before this, we have to check if everything is right. Looking at the gantt chart we can see a big picture about our project and therefore be able to visually view if there are some errors.
So, have a look at the Gantt in "views->gantt", should be like this
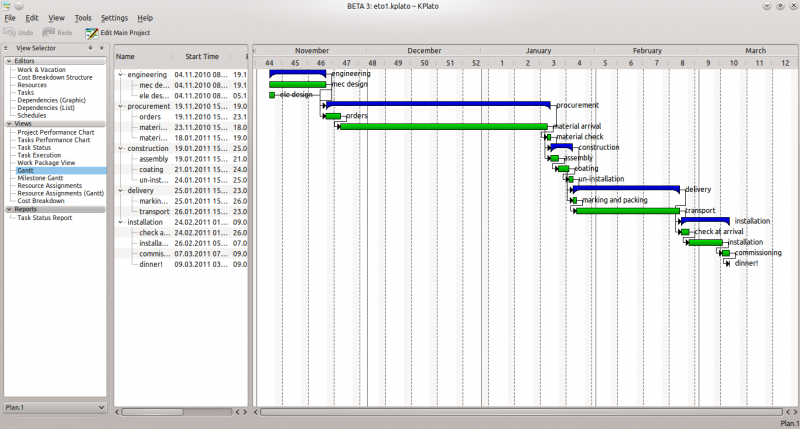
You can also configure the Gantt view to show scheduling errors!
If everything look right, we can proceed forward.
Project performance chart
At this point the project performance chart, show the baseline and the state before start. Should be like this:
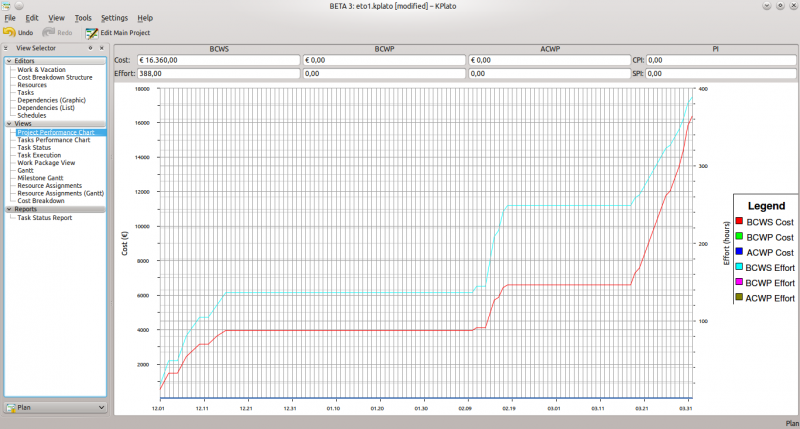
Where BCWS means Budgeted Cost Work Scheduled, BCWP means Budgeted Cost Work Performed, ACWP means Actual Cost Work Performed. All these are considered as effort and costs. PI are the Performance Indexes, where CPI is the Cost Performance Index and SPI is the Schedule Performance Index.
CPI is equal to BCWP/ACWP. When this index is below 1, means that you are over budget as ACWP is major than BCWP. If the index is over 1, means that the costs are under budget
SPI is equal to BCWP/BCWS. When this index is below 1, means that you are behind schedule. A value greater than 1 means that you are ahead of schedule.
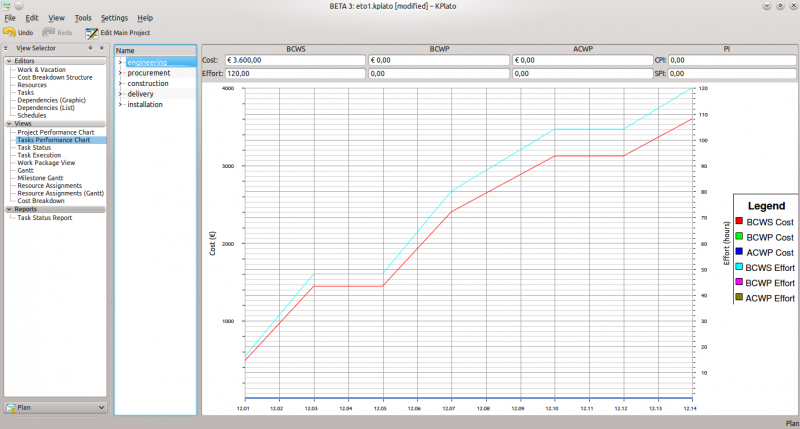
Task performance chart
On the "task performance chart" we can analyse deeply each task or group of tasks with the same index as before.
This is really useful in long and complicated project.
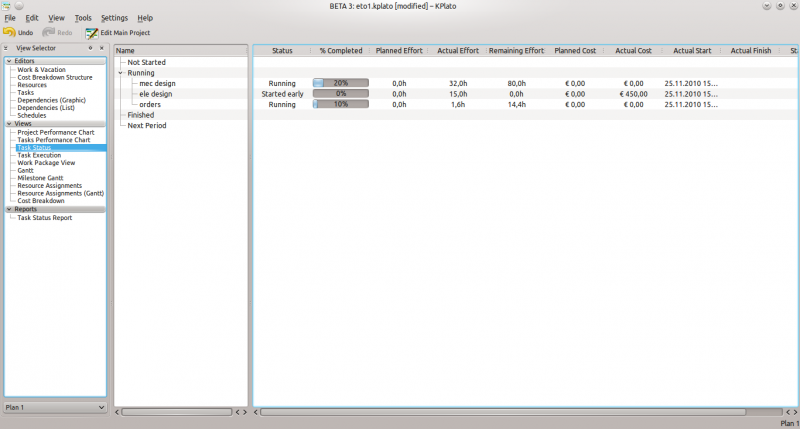
Task status
In the "task status view", you can check the actual situation of the project. Can be used as a daily check!
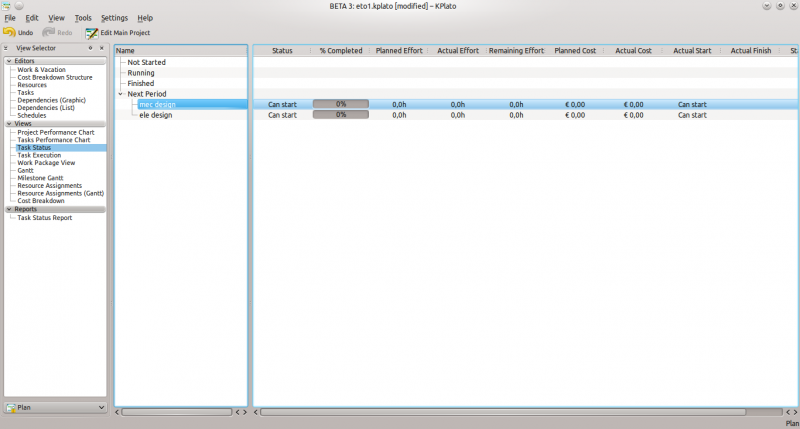
Is it time to simulate some work now!
So, let's start to enter some value, right clicking on the activity in the "next period" mec design and choose "progress" from the menu that appear. This will appear!
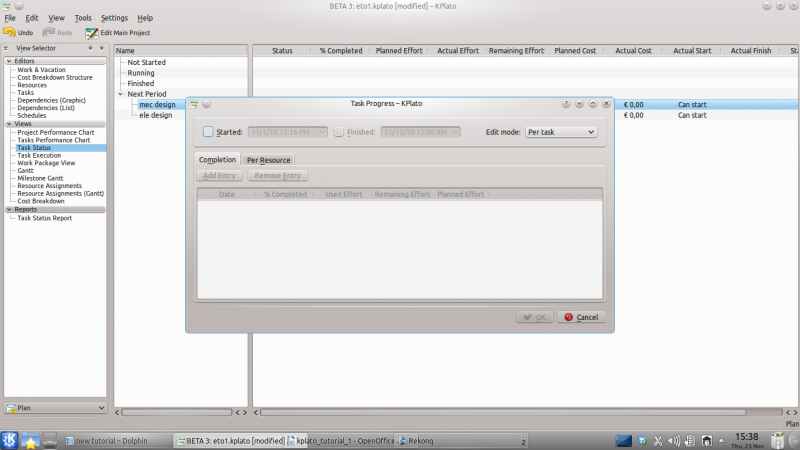
In this task progress window, we can choose to define the starting date of the task. Click on the Started button on the upper right corner of the window and choose the date.
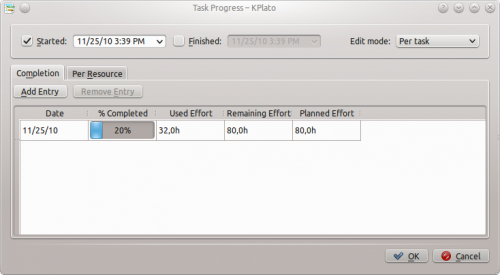
Than we choose to add a completion percentage for the task, clicking on the add entry in the tab completion. Than click on the %complete field and move the cursor that appear up to 20%. On the field at the right you can insert the effort used, in this case we will insert 32.
Note that the edit mode must be set to 'Per task' (default is 'Calculate Effort'). The final window will be like this one:
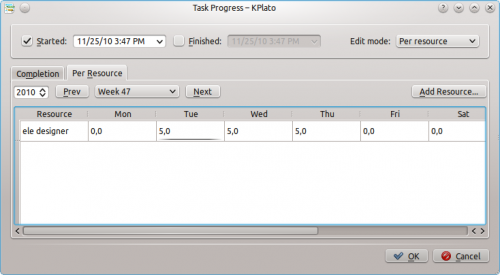
now we do the same for the second task that can be started, the "ele design". But for this task we choose the edit mode as "per resource" and compile the relative tab with 5 hours per day on tue, wed and thu. The result will be like below:
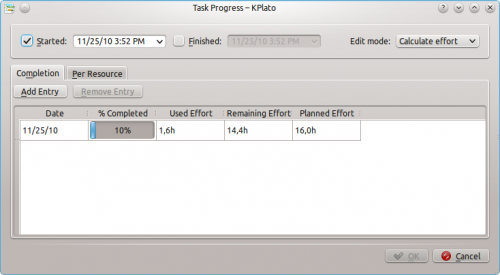
Than we move briefly to the task execution view and choose the "orders" task and insert the progression using the "calculate effort" edit mode. Choosing the data we started and the % complete to 10%, the effort will be calculated automatically and the result should be like below:
than moving to the task status menu we'll find the following:
Task execution
In the task execution we can have a general view of the things going on.
Note that BCWS are referred to Today!
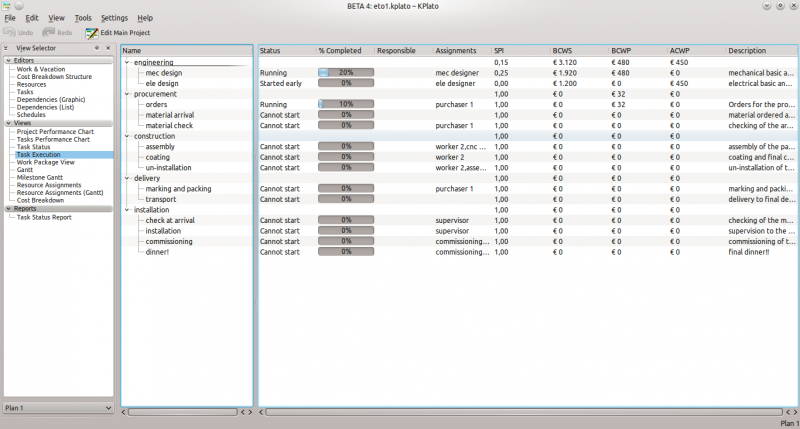
Is a reasonable view to have a general check!
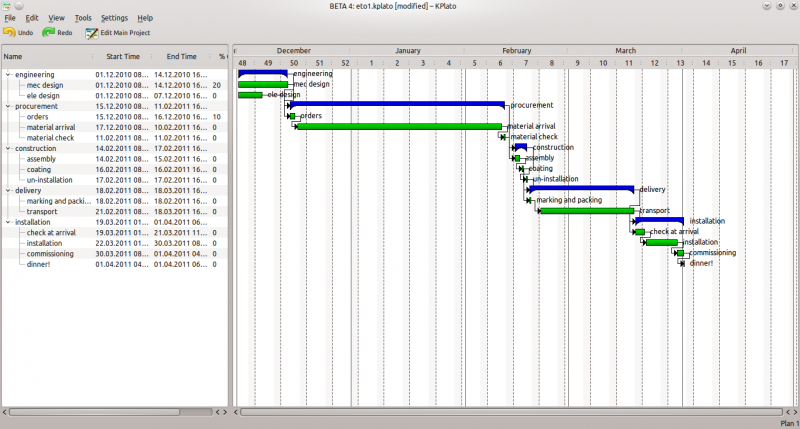
Gantt
The gantt menu is a typical gantt diagram where you can have a clear picture about the sequence and the duration of the project. With our example, will be like this.
To have a better view of the gantt diagram, it's possible to work on the zoom. This can be done right clicking on the upper part of the diagram where there are the months and days. This menù will appear:
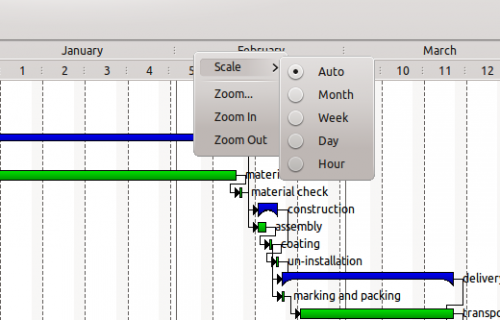
With this menu it's possible to change the scale or the zoom in/out. Most useful could be the "zoom..." selection that can zoom in or out by a small menu. Try it!!
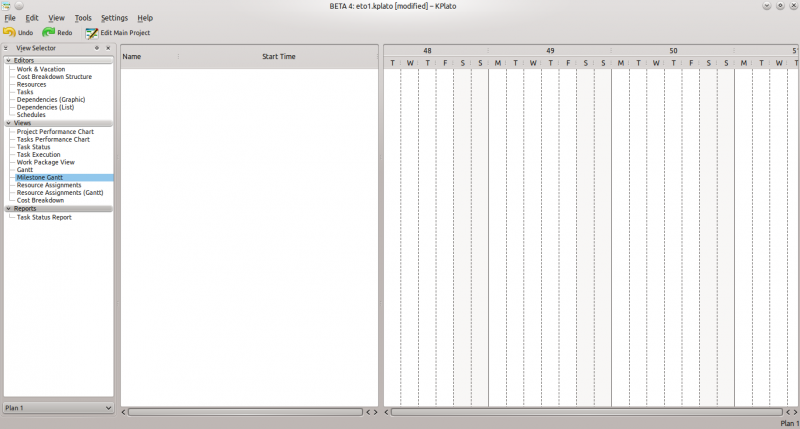
Milestone gantt
Milestone gantt is a part of the gantt diagram with a filter only to the milestones. In this project we do not have any, so the window will be blank!
Resource assignment
The resource assignment view let's you check which resource is used in which day, how many hours and for what.
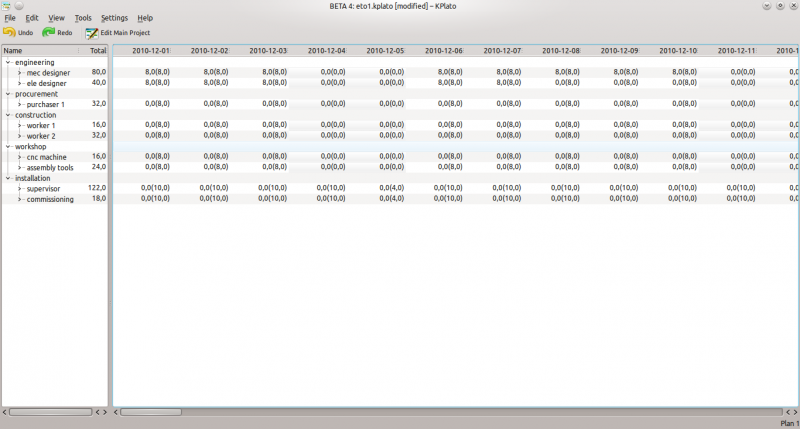
on the right window, between brackets are the hours of availability while just before the brackets the hours used for that resource.
Resource assignment gantt
The resource assignment gantt is a gantt diagram with the resource data. Can be useful to visualise the working period of the resources as well as quickly check about some availability to anticipate some tasks!
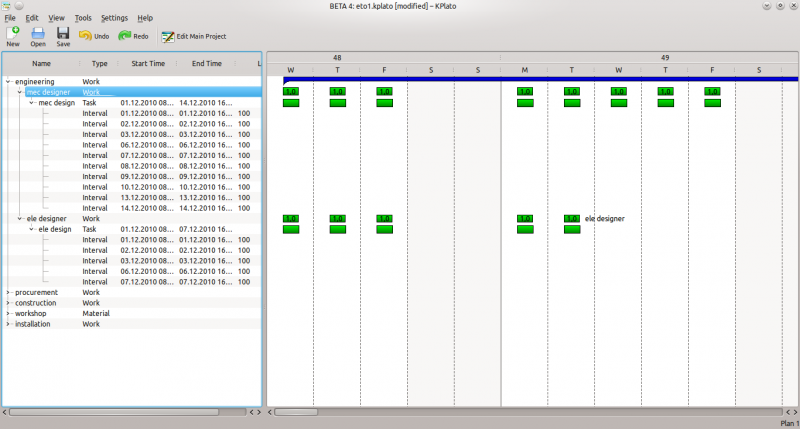
In this view we can see that the first resource is fully used for the first 3 days as in the main row related to the resource is written 1.0, this means 100%. than on the sub rows of the resource we can see the tasks and the time spent for each task.
Cost breakdown
The cost breakdown view represent the result of the accounting of the various tasks cost, generated according the cost assignment in the task and the cost breakdown structure that we decided at the beginning of the job.
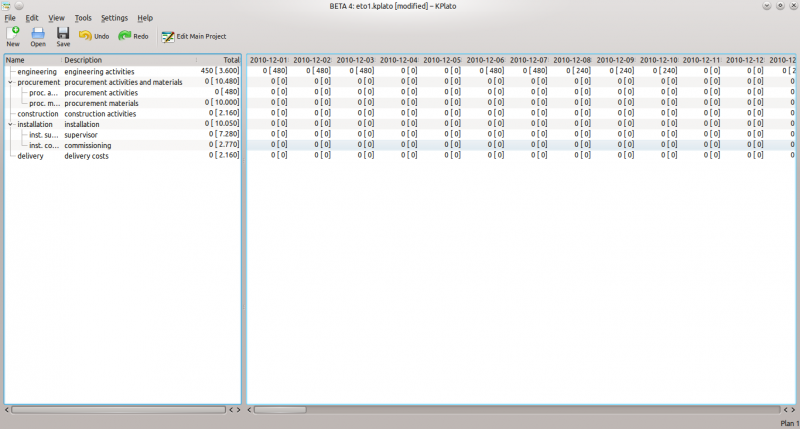
On the left windows, in the total column, between brackets there's the total sum for the project according the task, while just before the brackets is the actual total expenses.
Reports
Reports are still in a early stage but you can choose to export as pdf some views, which can be good as the report!


