QtiPlot: Difference between revisions
m (Formatting changes) |
m (Change deadlink) |
||
| Line 31: | Line 31: | ||
<!--T:7--> | <!--T:7--> | ||
* [ | * [https://www.qtiplot.com/ QtiPlot Homepage] | ||
* [http://soft.proindependent.com/doc/manual-en/index.html QtiPlot Manual] | * [http://soft.proindependent.com/doc/manual-en/index.html QtiPlot Manual] | ||
Revision as of 15:35, 16 December 2018
| QtiPlot analyzes and visualizes scientific data. |
Features
- Presents 2D and 3D data.
- Includes various data analysis functions like linear and non linear curve fitting.
- Rendering 3D using OpenGL using the Qwt3D libraries.
- Python scripting
- Various export formats (Bitmaps and Vector)
Screenshots
 |
 |
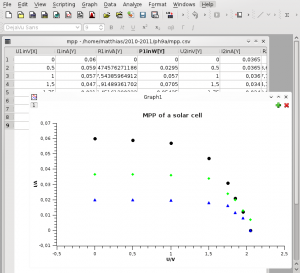
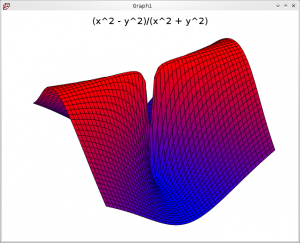
| Simply plotting some data from a table. | 3D plot of a surface with a singularity at the origin. |
