KmPlot: Difference between revisions
Appearance
Pipesmoker (talk | contribs) Starting KmPlot page |
Pipesmoker (talk | contribs) No edit summary |
||
| Line 4: | Line 4: | ||
{|style="text-align:center" cellpadding="2" | {|style="text-align:center" cellpadding="2" | ||
|[[Image:kmplot_welcome.png| | | [[Image:kmplot_welcome.png|350px|thumb]] | ||
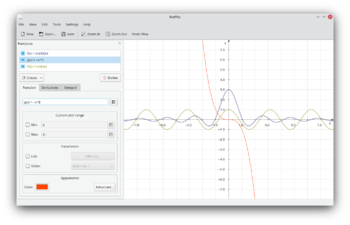
| '''KmPlot is a mathematical function plotter.''' | |||
|} | |} | ||
==Features== | ==Features== | ||
* | * powerful mathematical parser | ||
* precise metric printing | * precise metric printing | ||
* different plot types (functions, parametric, polar) | * different plot types (functions, parametric, polar) | ||
Revision as of 06:15, 31 May 2010
Template:I18n/Language Navigation Bar
 |
KmPlot is a mathematical function plotter. |
Features
- powerful mathematical parser
- precise metric printing
- different plot types (functions, parametric, polar)
- highly configurable visual settings (plot line, axes, grid)
- export to bitmap format (BMP and PNG) and scalable vector graphics (SVG)
- save/load complete session in readable xml format
- trace mode: cross hair following plot, coordinates shown in the status bar
- support zooming
- ability to draw the 1st and 2nd derivative and the integral of a plot function
- support user defined constants and parameter values
- various tools for plot functions: find minium/maximum point, get y-value and draw the area between the function and the y-axis

