KDevelop4/Manual/Debugging programs/uk: Difference between revisions
Created page with "| F12
| Вийти з інструкції ("finish" у gdb)" |
Created page with "Після вибору процесу, долучення до нього переведе '''KDevelop''' у режим зневаджування, відкриє всі зви..." |
||
| Line 23: | Line 23: | ||
This list of programs can be confusing because it is often long as in the case shown here. You can make your life a bit easier by going to the dropdown box at the top right of the window. The default value is <menuchoice>User processes</menuchoice>, i.e. all programs that are run by any of the users currently logged into this machine (if this is your desktop or laptop, you're probably the only such user, apart from root and various service accounts); the list doesn't include processes run by the root user, however. You can limit the list by either choosing <menuchoice>Own processes</menuchoice>, removing all the programs run by other users. Or better still: Select <menuchoice>Programs only</menuchoice>, which removes a lot of processes that are formally running under your name but that you don't usually interact with, such as the window manager, background tasks and so on that are unlikely candidates for debugging. | This list of programs can be confusing because it is often long as in the case shown here. You can make your life a bit easier by going to the dropdown box at the top right of the window. The default value is <menuchoice>User processes</menuchoice>, i.e. all programs that are run by any of the users currently logged into this machine (if this is your desktop or laptop, you're probably the only such user, apart from root and various service accounts); the list doesn't include processes run by the root user, however. You can limit the list by either choosing <menuchoice>Own processes</menuchoice>, removing all the programs run by other users. Or better still: Select <menuchoice>Programs only</menuchoice>, which removes a lot of processes that are formally running under your name but that you don't usually interact with, such as the window manager, background tasks and so on that are unlikely candidates for debugging. | ||
Після вибору процесу, долучення до нього переведе '''KDevelop''' у режим зневаджування, відкриє всі звичайні панелі зневаджування і зупинить програму на рядку, який виконувався під час долучення. На цьому етапі доцільно встановити точки зупину, точки перегляду або налаштувати інші елементи стеження за виконанням, а потім продовжити виконання програми за допомогою пункту меню <menuchoice>Виконання -> Продовжити</menuchoice>. | |||
<span id="Some useful keyboard shortcuts"></span> | <span id="Some useful keyboard shortcuts"></span> | ||
=== Деякі корисні клавіатурні скорочення === | === Деякі корисні клавіатурні скорочення === | ||
Revision as of 11:50, 28 May 2011
Зневаджування програм у KDevelop
Запуск програми під керуванням програми для зневаджування
Once you have a launch configured (see Running programs), you can also run it in a debugger: Select the menu item , or hit F9. If you are familiar with gdb, the effect is the same as starting gdb with the executable specified in the launch configuration and then saying Run. This means that if the program calls abort() somewhere (e.g. when you run onto a failing assertion) or if there is a segmentation fault, then the debugger will stop. On the other hand, if the program runs to the end (with or without doing the right thing) then the debugger will not stop by itself before the program is finished. In the latter case, you will want to set a breakpoint on all those lines of your code base where you want the debugger to stop before you run the debug launch. You can do that by moving the cursor on such a line and selecting the menu item , or right-clicking on a line and selecting from the context menu.

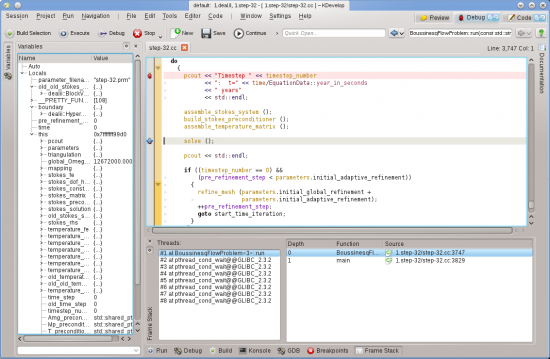
Running a program in the debugger will put KDevelop in a different mode: it will replace all the "Tool" buttons on the perimeter of the main window by ones that are appropriate for debugging, rather than for editing. You can see which of the mode you are in by looking at the top right of the window: there are tabs named , , and ; clicking on them allows you to switch back and forth between the three modes; each mode has a set of tool views of its own, which you can configure in the same way as we configured the tools above.
Once the debugger stops (at a breakpoint, or a point where abort() is called) you can inspect a variety of information about your program. For example, in the image above, we have selected the tool at the bottom (roughly equivalent to gdb's "backtrace" and "info threads" commands) that shows the various threads that are currently running in your program at the left (here a total of 8) and how execution got to the current stopping point at the right (here: main() called run(); the list would be longer had we stopped in a function called by run() itself). On the left, we can inspect local variables including the current object (the object pointed to by the this variable).
From here, there are various possibilities you can do: You can execute the current line (F10, gdb's "next" command), step into the functions (F11, gdb's "step" command), or run to the end of the function (F12, gdb's "finish" command). At every stage, KDevelop updates the variables shown at the left to their current values. You can also hover the mouse over a symbol in your code, e.g. a variable; KDevelop will then show the current value of that symbol and offer to stop the program during execution the next time this variable's value changes. If you know gdb, you can also click on the tool button at the bottom and have the possibility to enter gdb commands, for example in order to change the value of a variable (for which there doesn't currently seem to be another way).
Приєднання програми для зневаджування до запущеного процесу

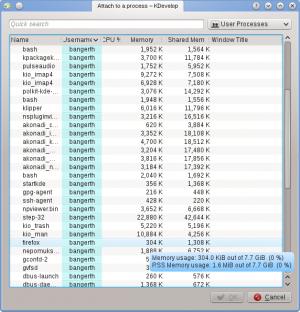
Sometimes, one wants to debug a program that's already running. One scenario for this is debugging parallel programs using MPI, or for debugging a long running background process. To do this, go to the menu entry , which will open a window like the one on the right. You will want to select the program that matches your currently open project in KDevelop - in my case that would be the step-32 program.
This list of programs can be confusing because it is often long as in the case shown here. You can make your life a bit easier by going to the dropdown box at the top right of the window. The default value is , i.e. all programs that are run by any of the users currently logged into this machine (if this is your desktop or laptop, you're probably the only such user, apart from root and various service accounts); the list doesn't include processes run by the root user, however. You can limit the list by either choosing , removing all the programs run by other users. Or better still: Select , which removes a lot of processes that are formally running under your name but that you don't usually interact with, such as the window manager, background tasks and so on that are unlikely candidates for debugging.
Після вибору процесу, долучення до нього переведе KDevelop у режим зневаджування, відкриє всі звичайні панелі зневаджування і зупинить програму на рядку, який виконувався під час долучення. На цьому етапі доцільно встановити точки зупину, точки перегляду або налаштувати інші елементи стеження за виконанням, а потім продовжити виконання програми за допомогою пункту меню .
Деякі корисні клавіатурні скорочення
| Зневаджування | |
|---|---|
| F10 | Перейти до наступної інструкції ("next" у gdb) |
| F11 | Увійти у наступну інструкцію ("step" у gdb) |
| F12 | Вийти з інструкції ("finish" у gdb) |
