LabPlot: Difference between revisions
Appearance
No edit summary |
No edit summary |
||
| Line 41: | Line 41: | ||
** [https://en.wikipedia.org/wiki/LabPlot Main article] | ** [https://en.wikipedia.org/wiki/LabPlot Main article] | ||
** [https://en.wikipedia.org/wiki/List_of_information_graphics_software List of information graphics software] | ** [https://en.wikipedia.org/wiki/List_of_information_graphics_software List of information graphics software] | ||
** [https://en.wikipedia.org/wiki/ | ** [https://en.wikipedia.org/wiki/Comparison_of_numerical-analysis_software Comparison of numerical-analysis software] | ||
Revision as of 08:03, 12 September 2020

|
LabPlot is an application for interactive graphing and analysis of scientific data. LabPlot provides an easy way to create, manage and edit plots and to perform data analysis. |
Introduction
LabPlot supports 2D-plotting, data analysis (e.g Fourier transformation, Linear and non-linear regression analysis), computing with computer algebra systems (CAS) like Maxima and GNU Octave and importing and exporting to many formats.
A complete list of LabPlot features is available in LabPlot webpage.
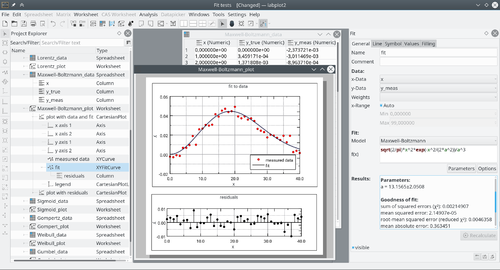
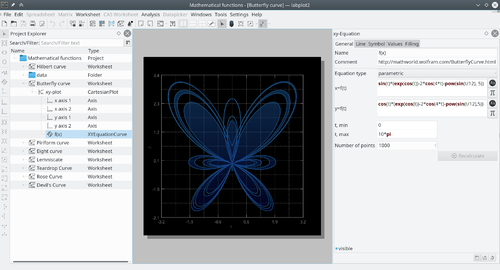
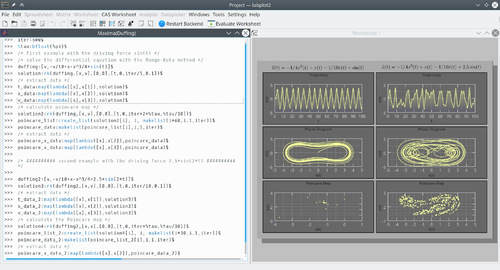
Screenshots


More screenshots can be viewed at LabPlot webpage.
