System Activity: Difference between revisions
m grey->gray |
No edit summary |
||
| Line 62: | Line 62: | ||
Chose '''Show Column 'pid' '''. | Chose '''Show Column 'pid' '''. | ||
==Why are some | ==Why are some processes grayed out?== | ||
For example the process '''xclock''': | For example the process '''xclock''': | ||
| Line 70: | Line 70: | ||
This means that the process has already died. It is shown as a disabled | This means that the process has already died. It is shown as a disabled | ||
process just for convenience to make it easier to see processes that are quit. | process just for convenience to make it easier to see processes that are quit. | ||
The values for the CPU usage, Memory usage, etc are just the values from when the process was last seen alive. A process that has ended does not take up any resources (It uses no CPU, memory etc). | |||
[[Category:System]] | [[Category:System]] | ||
Revision as of 14:21, 2 February 2010
Template:I18n/Language Navigation Bar
Introduction
System Activity is akin to the Microsoft Window's Task Manager, Apple's Mac OS X's Activity Monitor and Gnome's System Monitor. It pops up when you press the keyboard shortcut Ctrl+Esc or from the System Activity icon,![]() , in a KRunner (Alt-F2) window.
, in a KRunner (Alt-F2) window.
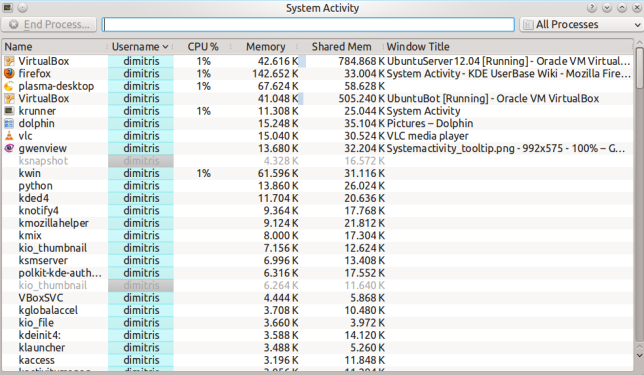
It shows a list of currently running processes, along with their CPU usage, Memory usage, and various other pieces of information.
General Tips
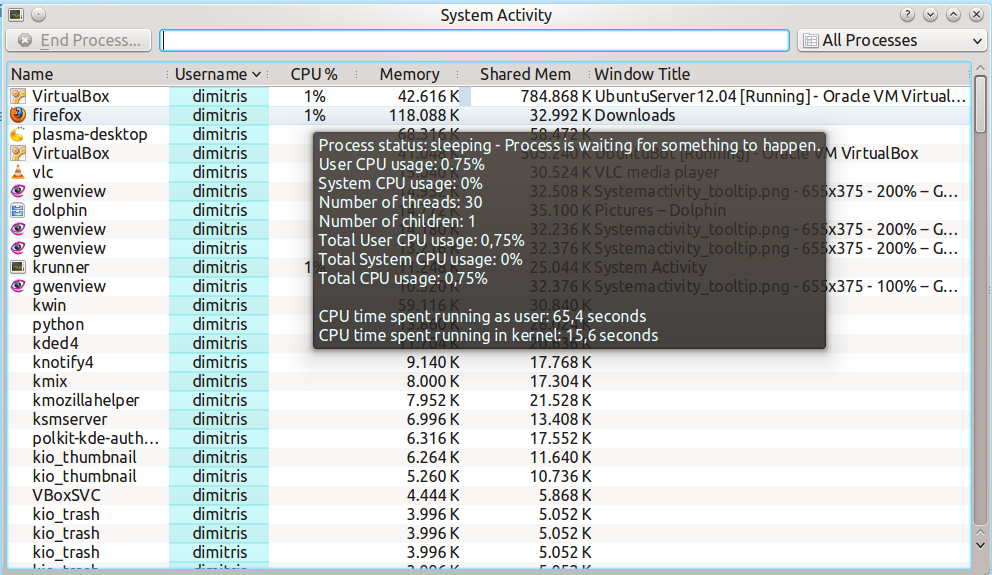
Almost every part of the UI displays a tooltip, when you hover the mouse over it for long enough, to provide more detailed information, and WhatsThis functionality, activated by clicking the ![]() button, to explain what the information means.
button, to explain what the information means.
For example, hovering over the CPU usage for a process we can see various other bits of information including how much time the program has been running for in total.
Why is my system currently running slowly?
A system can be running unusually slow because a process (program) is demanding all of the computer's processing power (CPU usage) or is using all of the computer's memory.
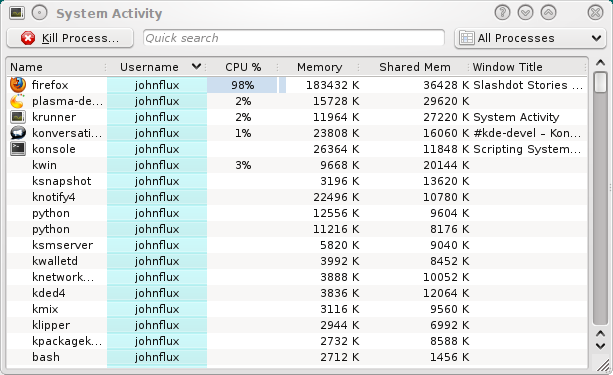
By default, processes owned by the current user that are using a lot of CPU or memory are near the top. This means that any misbehaving programs should be near the top and easily visible. For example:
In this example, firefox has stopped responding and is using 99% of CPU. To end the process that is misbehaving, click on the process to select it and press the "Kill Process..." button. This will send a polite request to the program, asking it to close.
I can't kill it - it just won't die!
Thankfully it's fairly rare, but just occasionally you may meet this. If the process is misbehaving it may ignore your request to end, so we may need to force the program to end immediately. Doing this may result in any documents etc that the program had opened but not saved. To do this, right click on the process and chose "Send Signal" then choose "Kill (KILL)".
Zombie processes
Processes which are in a Zombie state are already dead, and so cannot be killed. The system keeps them around until their parent process notices, which is usually a very short amount of time. Seeing a Zombie process usually indicates that the parent process has stopped responding.
Targeting a window to kill
If you want to kill a particular window that has frozen up, simply press Ctrl+Alt+Esc at any time. The mouse cursor should turn into an image of a skull and cross bones. Now click the window that you want to kill. Note that this will kill the application immediately, and you may lose any unsaved data.
Memory is the amount of memory (RAM) that the process is using by itself. Shared memory is memory that is, or could be, shared with other programs. For example, the KDE libraries are used by all KDE programs and so are loaded into memory only once.
Technical Information
The Memory column shows the value of VmRSS - Shared, and so is generally lower than the values shown by top etc. This does not include memory backed I/O pages, and does not include memory used by the x server to store any pixmaps used by the application. This value is often called the Unique RSS size, or URSS.
The Shared memory is the same as the SHR column in top.
Why is the 'Xorg' process using so much memory?
This is the process that displays all the other applications. Its memory usage includes all the memory used on the video card to store all the pixmaps (images) from applications.
In general you do not need to worry about the memory usage of xorg.
How do I see the PID of a process?
If you want to see the PID of a single process, hover the mouse cursor over the name of the process. The PID will be shown in the tooltip.
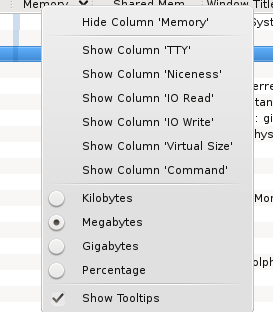
If you want to see the PID of all the processes, right click on any column heading and you will see the menu:
Chose Show Column 'pid' .
Why are some processes grayed out?
For example the process xclock:
This means that the process has already died. It is shown as a disabled process just for convenience to make it easier to see processes that are quit. The values for the CPU usage, Memory usage, etc are just the values from when the process was last seen alive. A process that has ended does not take up any resources (It uses no CPU, memory etc).


