LabPlot/en: Difference between revisions
Appearance
Importing a new version from external source |
Updating to match new version of source page |
||
| Line 3: | Line 3: | ||
{|class="tablecenter vertical-centered" | {|class="tablecenter vertical-centered" | ||
| [[Image:LabPlot.png|64px]] | | [[Image:LabPlot.png|64px]] | ||
| '''LabPlot''' is an application for interactive graphing and analysis of scientific data. '''LabPlot''' provides an easy way to create, manage and edit plots and to perform data analysis | | '''LabPlot''' is an application for interactive graphing and analysis of scientific data. '''LabPlot''' provides an easy way to create, manage and edit plots and to perform data analysis. | ||
|} | |} | ||
Revision as of 12:30, 1 May 2017

|
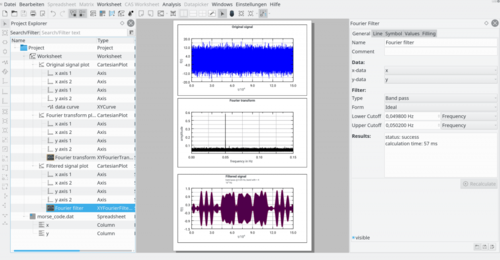
LabPlot is an application for interactive graphing and analysis of scientific data. LabPlot provides an easy way to create, manage and edit plots and to perform data analysis. |

The LabPlot web page is here.
