LabPlot
Appearance

|
LabPlot — програма для інтерактивної побудови графіків та аналізу наукових даних. У LabPlot передбачено прості засоби для створення, керування та редагування рисунків та аналізу даних. |
Features
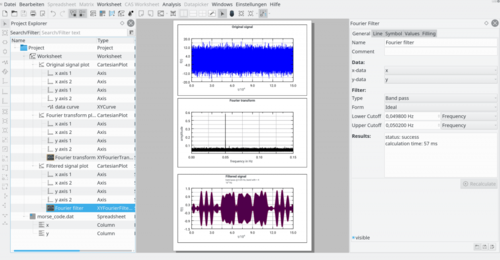
LabPlot support 2D-plotting, data analysis (e.g Fourier transformation, Linear and non-linear regression analysis), computing with computer algebra systems (CAS) like Maximas and GNU Octave and importing and exporting to many format.
A complete list of LabPlot features is available in LabPlot webpage.
Screenshots

More screenshots can be viewed at LabPlot webpage.
