Uploads by Pipesmoker
This special page shows all uploaded files.
| Date | Name | Thumbnail | Size | Description | Versions |
|---|---|---|---|---|---|
| 09:08, 29 June 2010 | Kiten search.png (file) |  |
24 KB | 1 | |
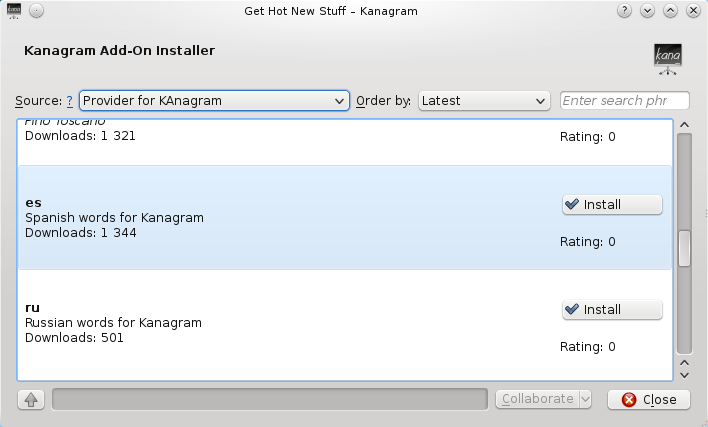
| 20:12, 28 June 2010 | Kanagram knewstuff.png (file) |  |
44 KB | 2 | |
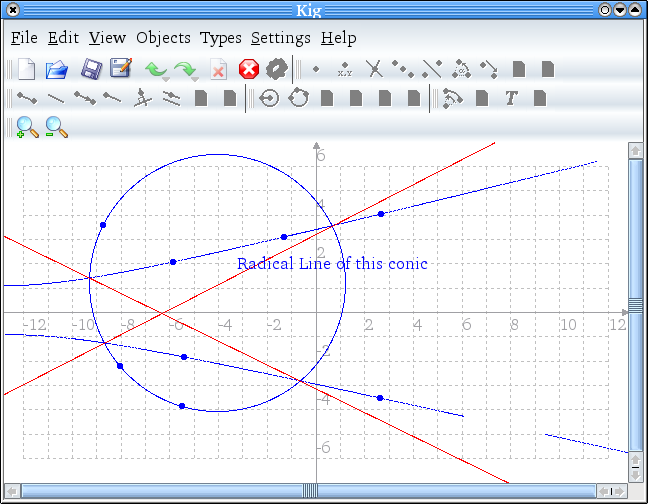
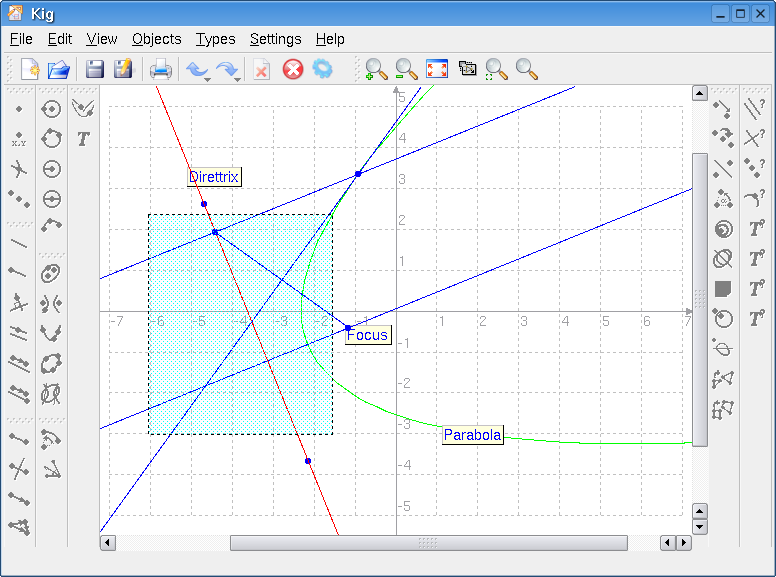
| 18:24, 25 June 2010 | Kig-radical line.png (file) |  |
27 KB | One of the cool Conic objects by Maurizio Paolini: the radical line of two conics | 1 |
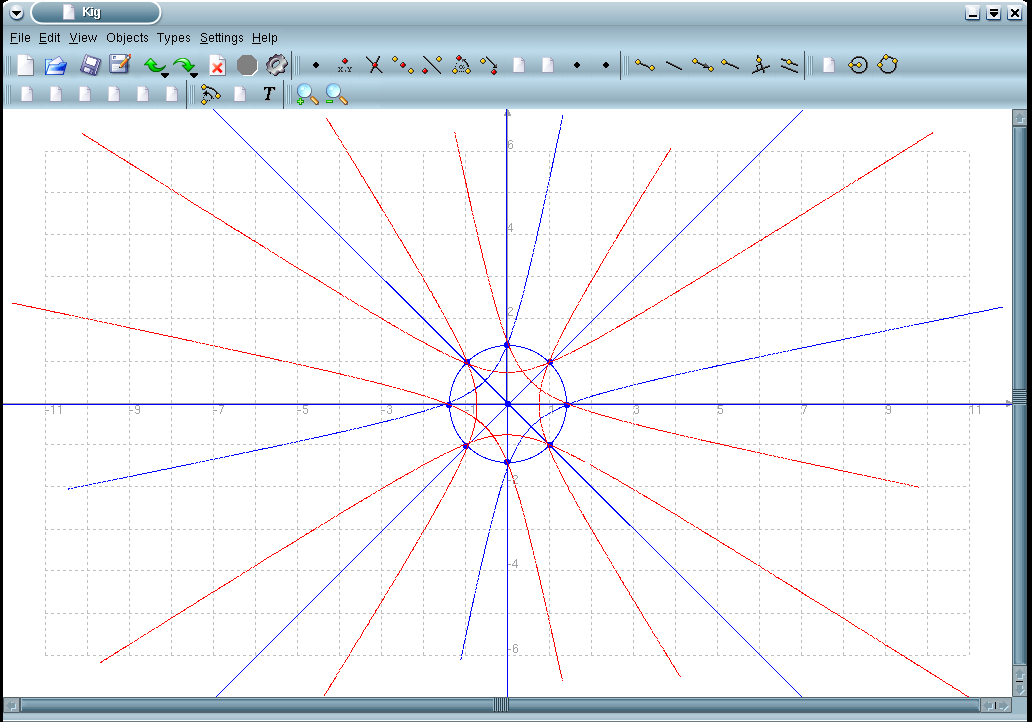
| 18:21, 25 June 2010 | Kig pattern 2.png (file) |  |
35 KB | Another pattern constructed with '''Kig''' | 1 |
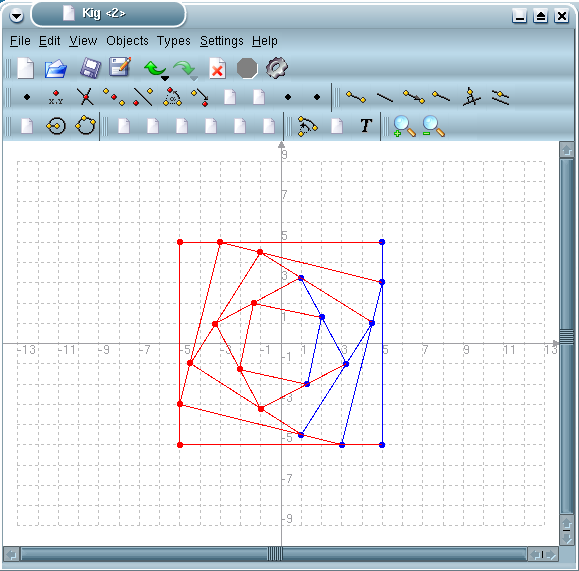
| 18:20, 25 June 2010 | Kig-pattern 1.png (file) |  |
25 KB | Nice pattern constructed with '''Kig''' | 1 |
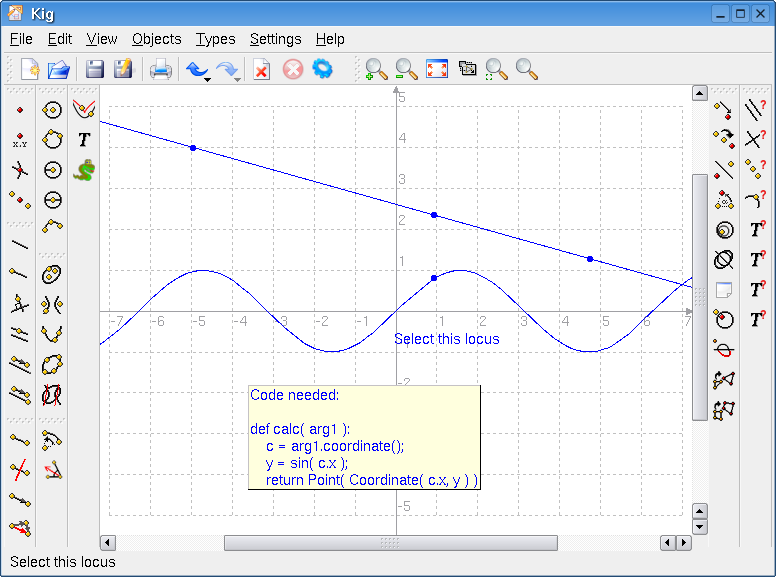
| 18:18, 25 June 2010 | Kig-sine-curve.png (file) |  |
36 KB | A sine-curve in '''Kig''', created using a combination of the new Python Scripting feature, and the support for loci | 1 |
| 18:16, 25 June 2010 | Kig-polygons.png (file) |  |
32 KB | '''Kig''' dealing with polygons, with the construction of a regular polygon | 1 |
| 18:15, 25 June 2010 | Kig-select and names.png (file) |  |
33 KB | A selection box and some objects with a label showing their names | 1 |
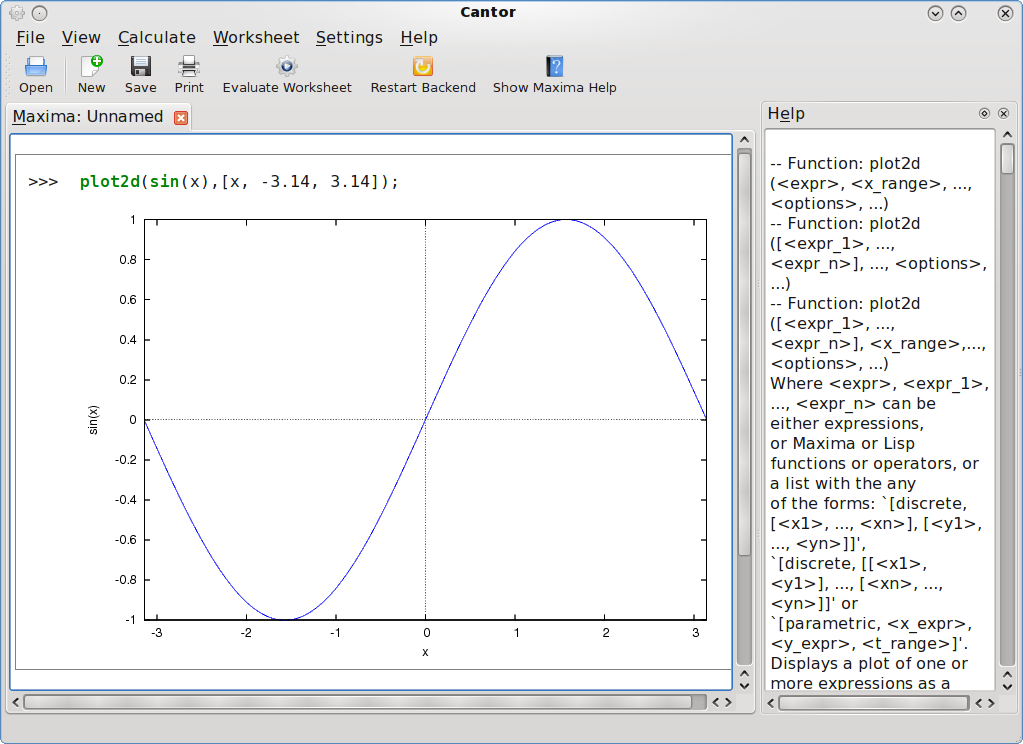
| 08:23, 24 June 2010 | Cantor maxima plot.png (file) |  |
129 KB | Sample plot using Maxima-backend | 1 |
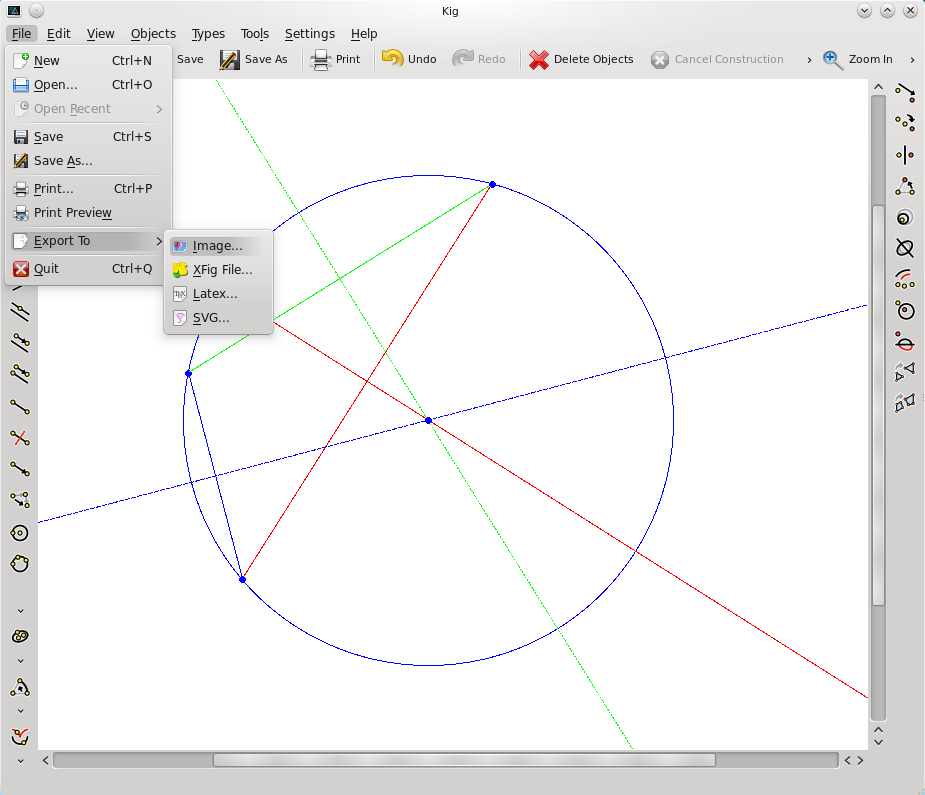
| 15:49, 1 June 2010 | Kig-exports.png (file) |  |
94 KB | 1 | |
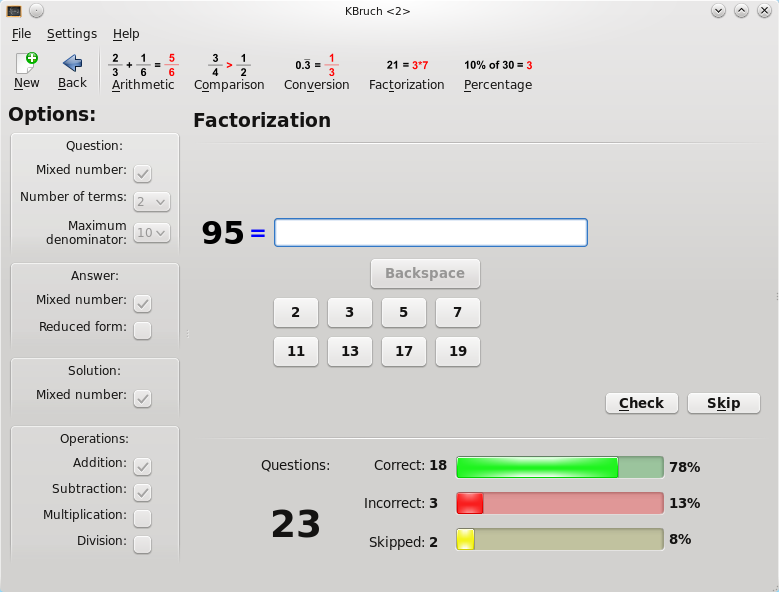
| 09:16, 31 May 2010 | Kbruch-factorize.png (file) |  |
77 KB | KBruch screenie of factorize exercise | 1 |
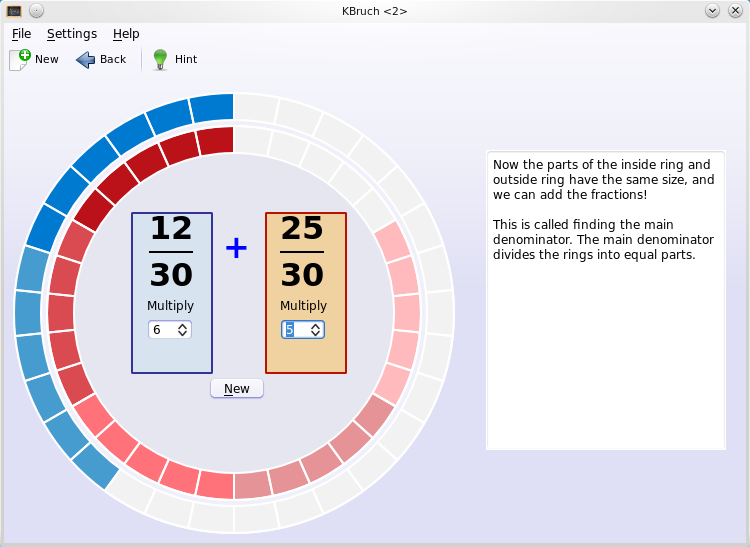
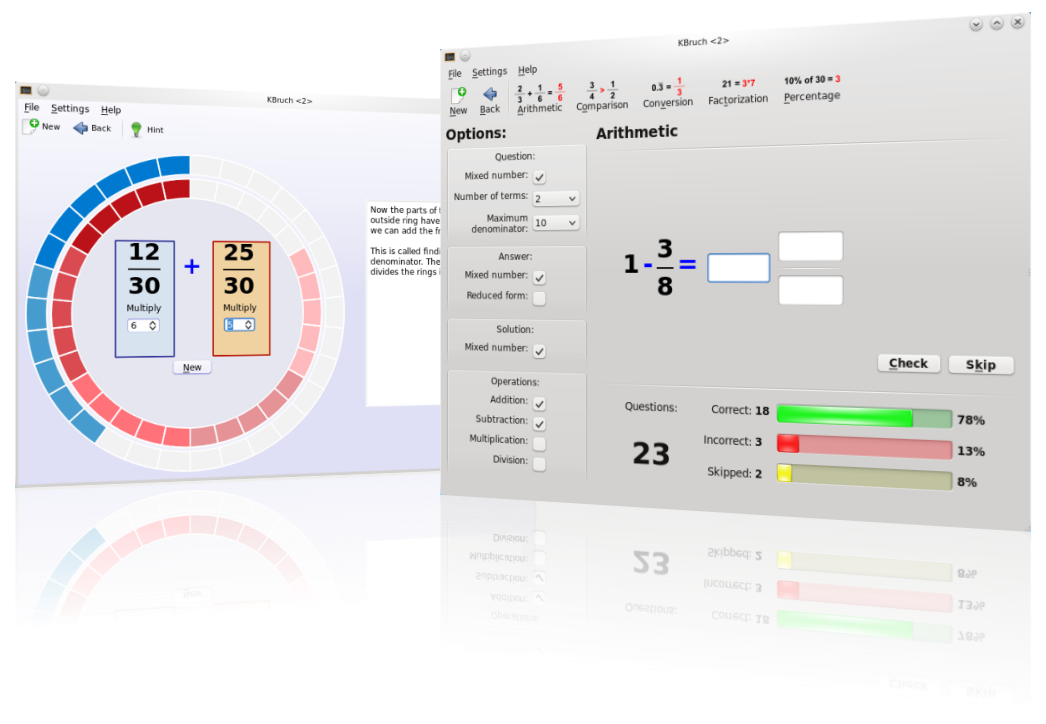
| 08:58, 31 May 2010 | Kbruch-learning.png (file) |  |
87 KB | KBruch screenie of learning mode | 1 |
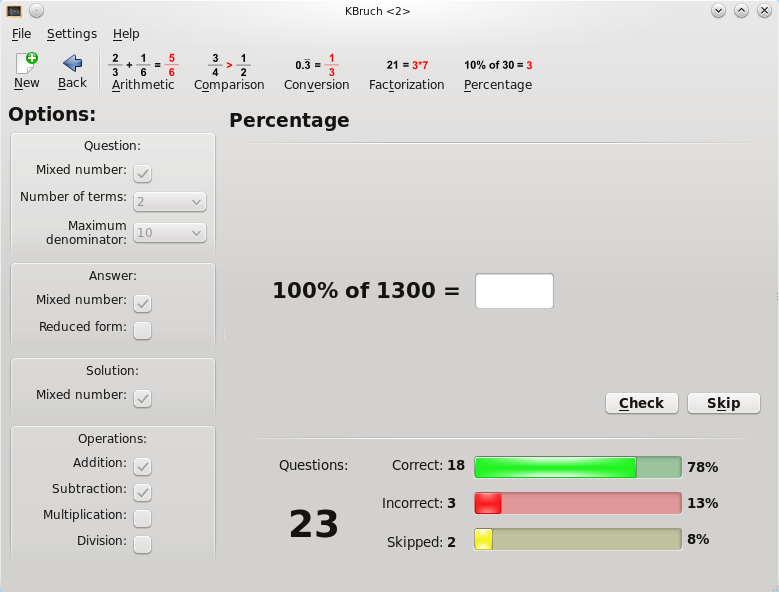
| 08:57, 31 May 2010 | Kbruch-percentage.png (file) |  |
74 KB | KBruch screenie of percentage exercise | 1 |
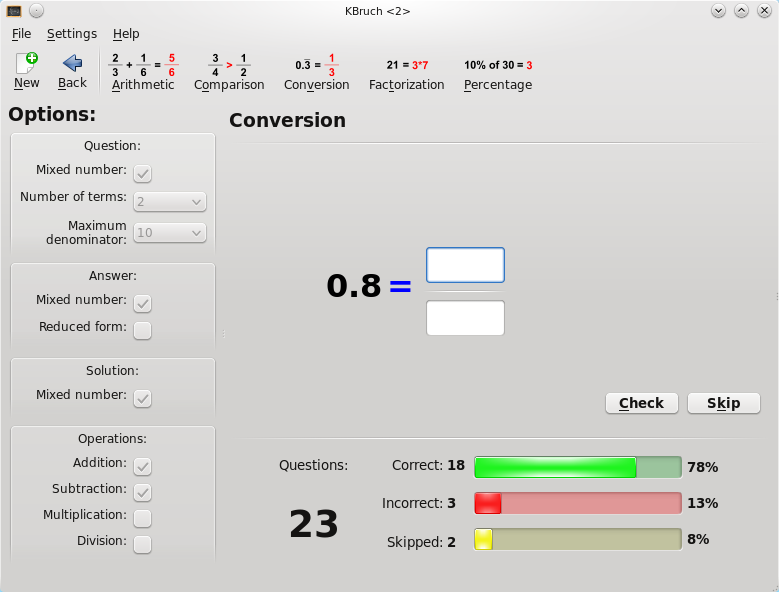
| 08:57, 31 May 2010 | Kbruch-conversion.png (file) |  |
73 KB | KBruch screenie of conversion exercise | 1 |
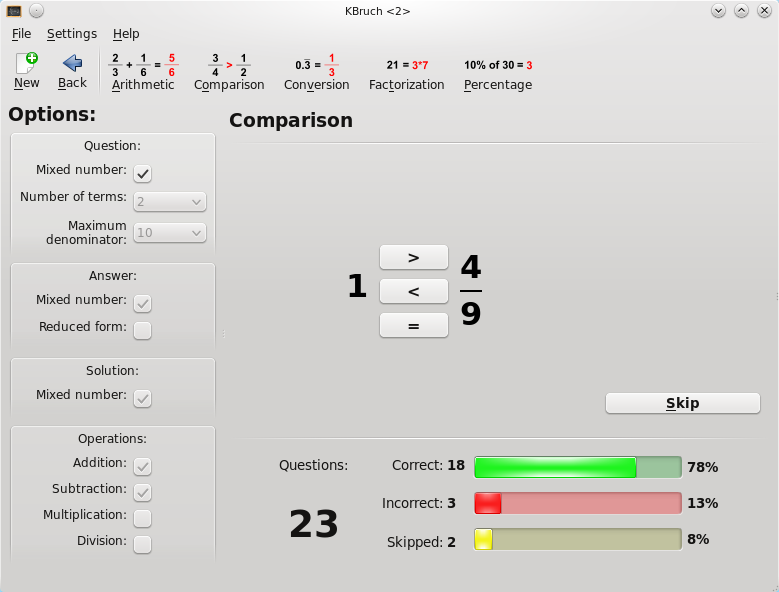
| 08:56, 31 May 2010 | Kbruch-comparison.png (file) |  |
73 KB | KBruch screenie of comparison exercise | 1 |
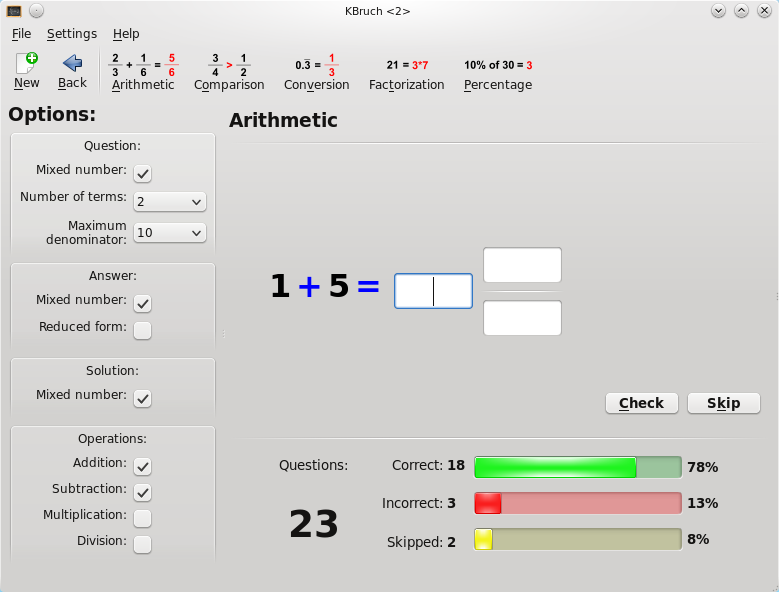
| 08:56, 31 May 2010 | Kbruch-common.png (file) |  |
73 KB | KBruch screenie of common exercise | 1 |
| 08:41, 31 May 2010 | Kbruch welcome.png (file) |  |
240 KB | 2 | |
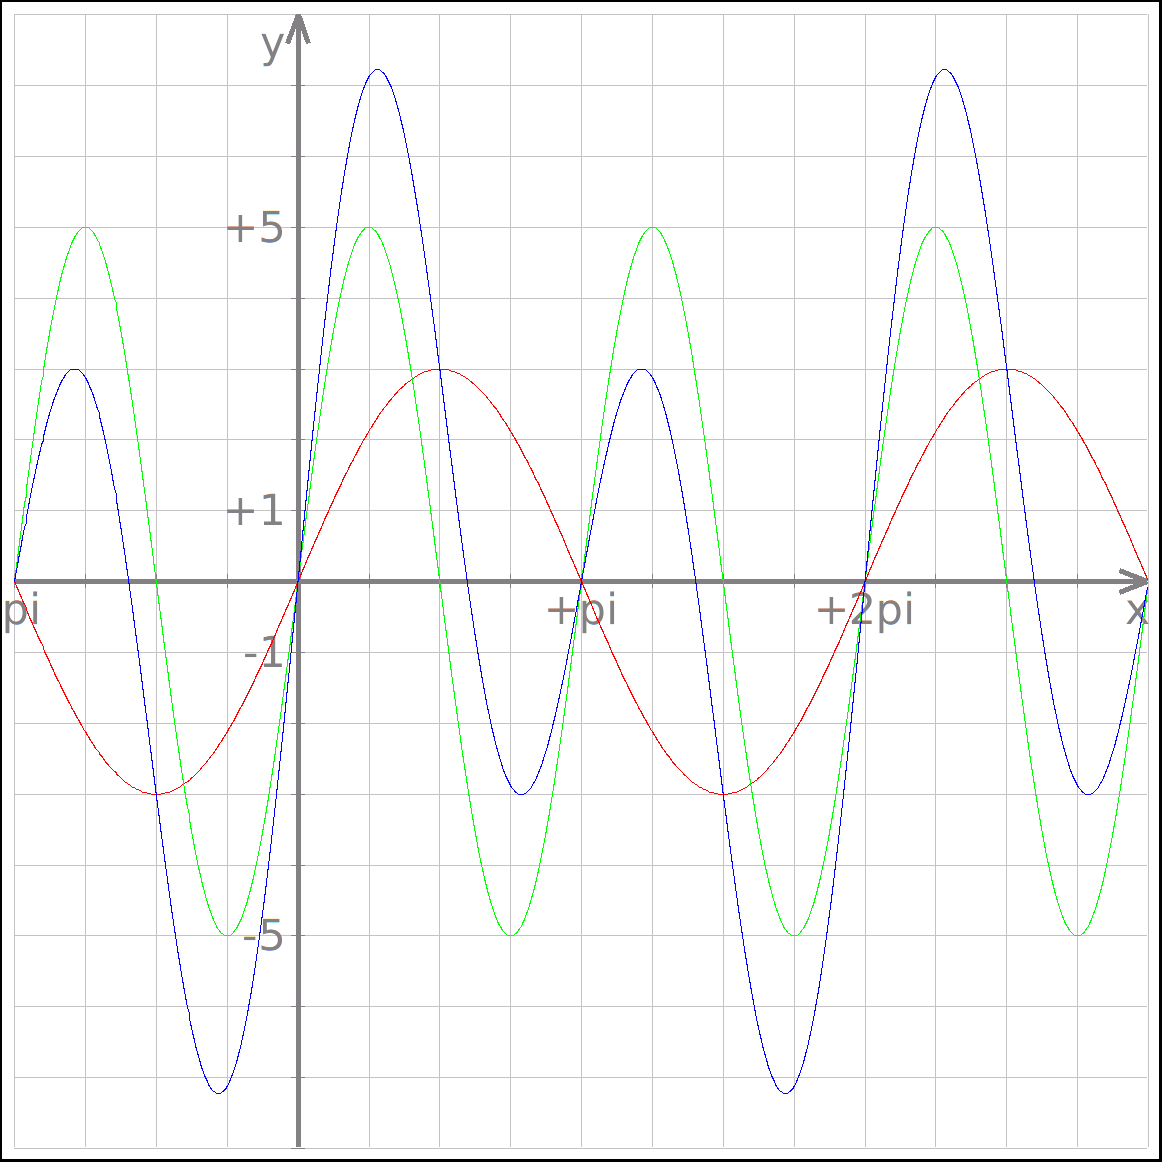
| 06:23, 31 May 2010 | Kmplot sum of functions.png (file) |  |
23 KB | KmPlot example plot using sum of functions :f(x)=3sin x :g(x)=5cos(2x-pi/2) :h(x)=f(x)+g(x) | 1 |
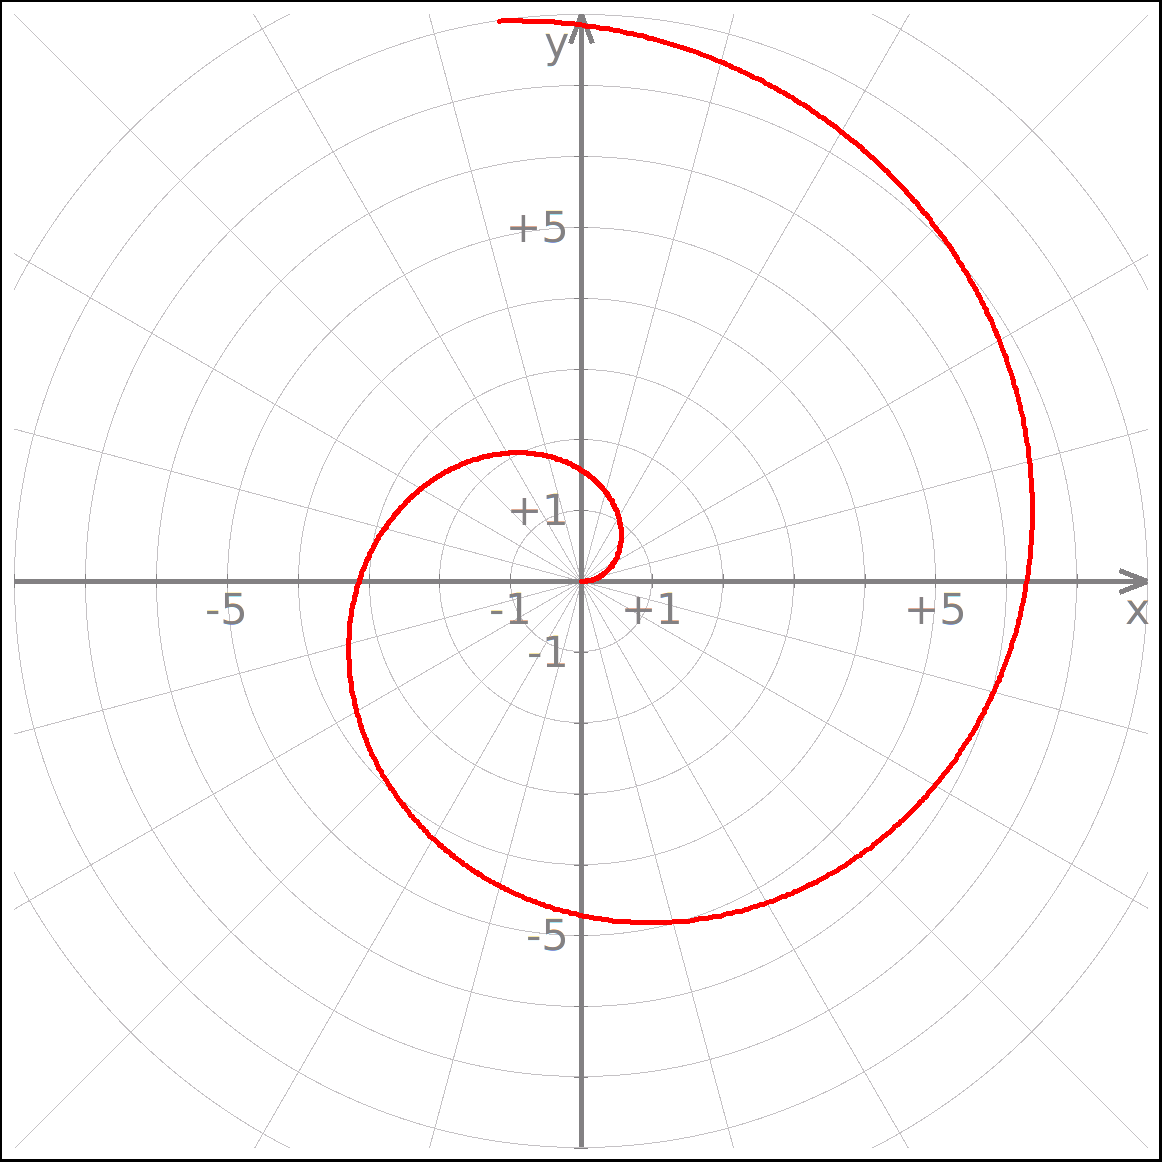
| 06:22, 31 May 2010 | Kmplot spiral.png (file) |  |
32 KB | KmPlot example plot :rf(x)=x | 1 |
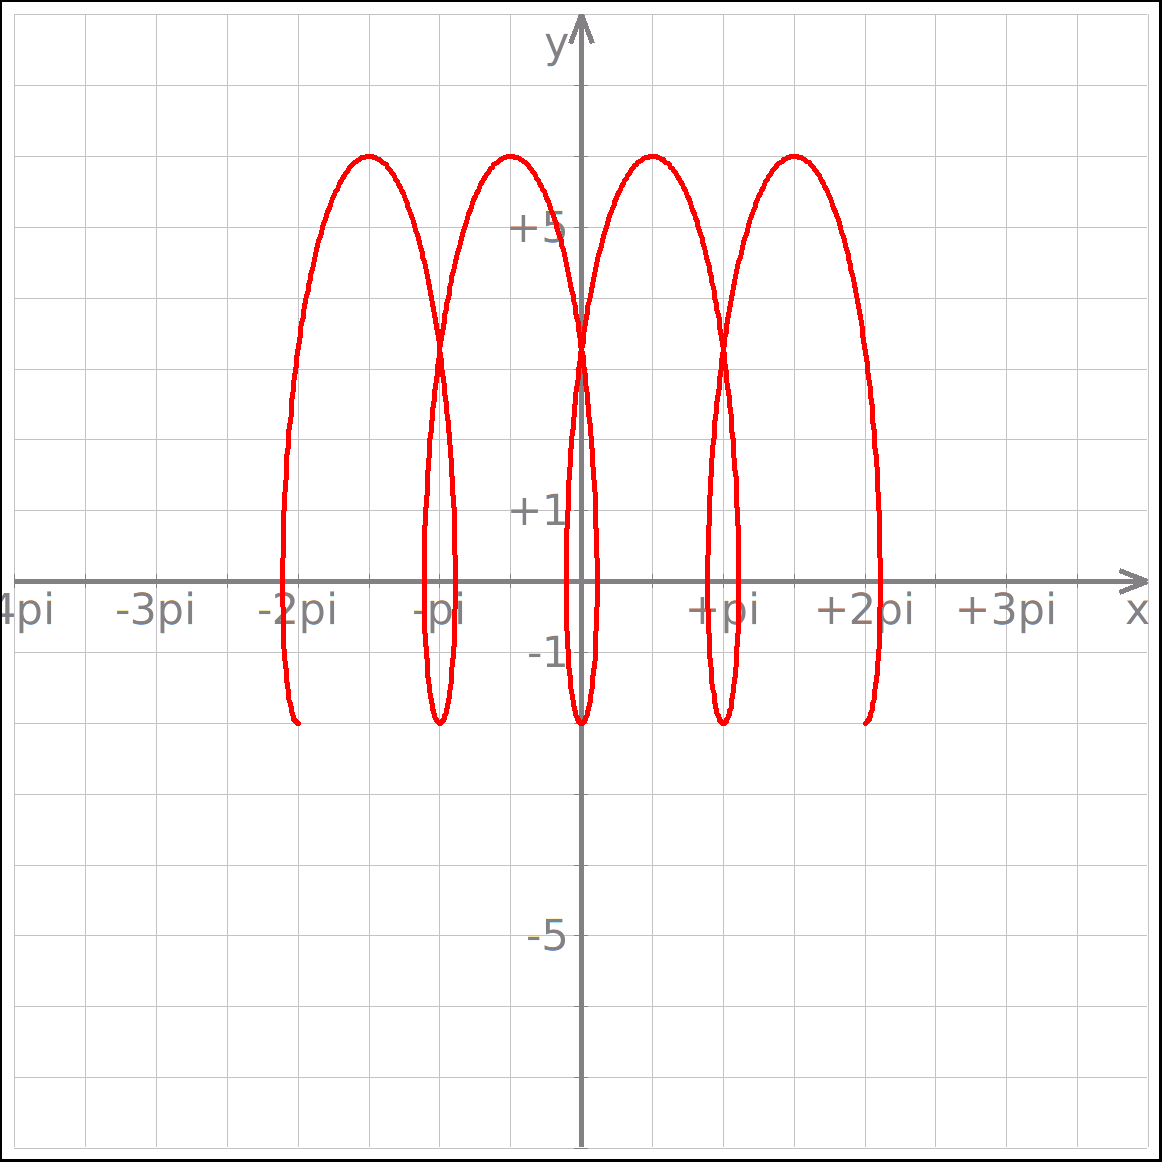
| 06:21, 31 May 2010 | Kmplot lisajou.png (file) |  |
17 KB | KmPlot example plot :x(t)=5sin(3t) :y(t)=3cos(5t) | 1 |
| 06:20, 31 May 2010 | Kmplot cycloide.png (file) |  |
17 KB | KmPlot example plot :x(t)=0.5(t-2sin t) :y(t)=2(1-2cos t) | 1 |