KmPlot
Appearance
Домівка » Програми » Освіта » KmPlot/uk
↓ {|
|  | KmPlot — програма для креслення графіків функцій.
Програма є частиною освітнього проекту KDE.
|}
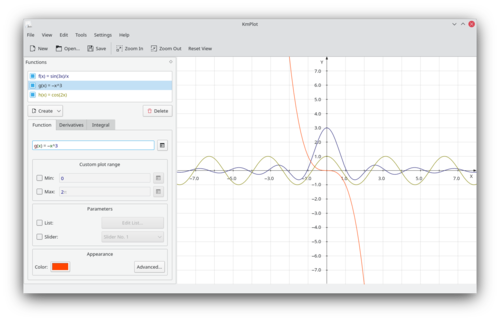
У програму вбудовано потужний інтерпретатор математичних функцій. Креслення, створені за допомогою програми, мають високу роздільну здатність, можливе використання точної метричної шкали. Роздруковані графіки будуть корисними для занять з математики та інших точних дисциплін.
У KmPlot передбачено креслення декількох функцій одночасно та поєднання функцій для створення нових графіків. Можна будувати параметричні функції. Змінити значення параметра можна пересуванням повзунка, — програма інтерактивно змінюватиме графік побудованої функції.
Можливості
- powerful mathematical parser
- precise metric printing
- different plot types:
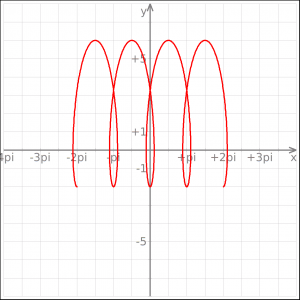
- Cartesian
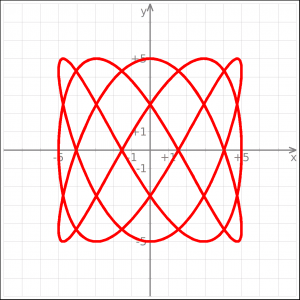
- parametric
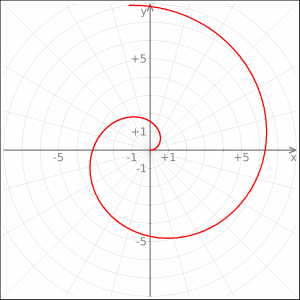
- polar
- implicit
- differential
- highly configurable visual settings (plot line, axes, grid)
- export to bitmap format (BMP and PNG) and scalable vector graphics (SVG)
- save/load complete session in readable xml format
- trace mode: cross hair following plot, coordinates shown in the status bar
- support zooming
- ability to draw the 1st and 2nd derivative and the integral of a plot function
- support user defined constants and parameter values
- various tools for plot functions:
- find minimum/maximum point
- get y-value and draw the area between the function and the y-axis
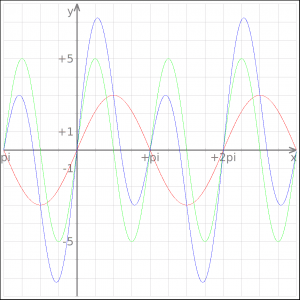
Example Plots
|
|
|
|
