KDevelop5/Manual/Tool list/Code browser
 |
interactively shows you information about your code |
Caveat! This page was not written by the software author, but rather by a user trying to understand how this feature works. I may not have all of this correct. This tool seems to be one of the more powerful parts of KDevelop, and hopefully in time it will become better documented. (Or perhaps there is better documentation for it elsewhere, but I haven't yet found that documentation.) So you've been warned.
ABOUT the Code Browser Tool
The Code Browser "tool" (i.e. add-on or plugin) interactively shows you automatically parsed and helpful information about your code.
As you hover over different parts of your code you can see what the automatic parser knows and thinks about it! Also you can click links to inspect or move to related code.
SETUP
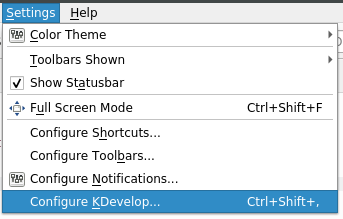
1) From the main KDevelop menu select →
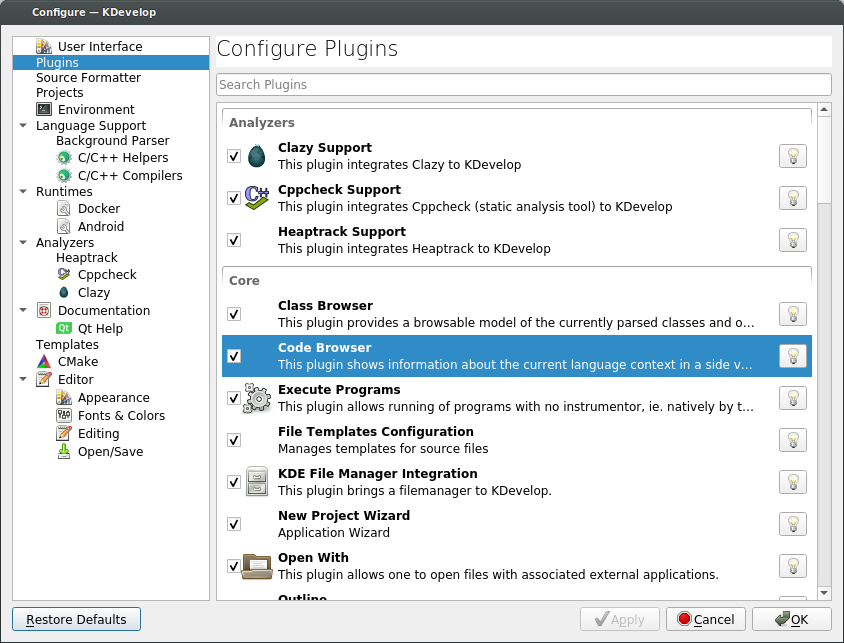
then in the dialog that opens select , and under Configure Plugins scroll down to Code Browser and check the checkbox there.
Then select .
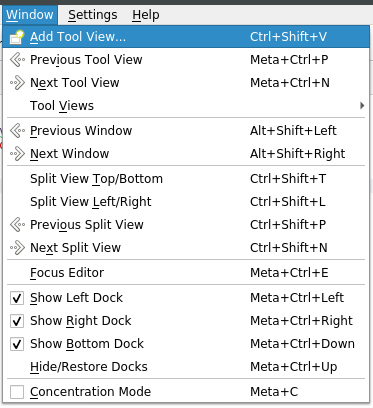
2) From the main KDevelop menu select →
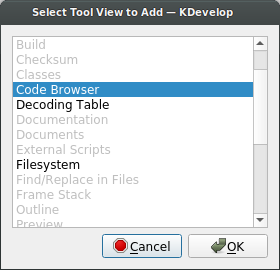
then highlight Code Browser and click .
USE
Hover your mouse over your source code to show information about parts of that source code.
How this information is displayed depends on
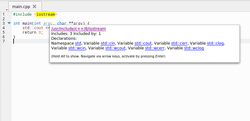
1) if you don't have the Code Browser pane enabled (i.e. by un-high lighting the "Code Browser button on the edge of the main window) then this information is displayed as a tool tip. Here is an example of that:
or
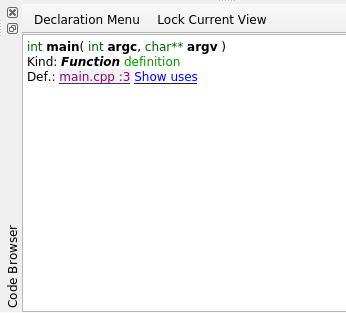
2) if you do have the Code Browser pane enabled (ie. by high lighting the "Code Browser button on the edge of the main window) ![]() then this information is displayed in that pane. The display pane will say 'Code Browser' edgewise on this pane. Here is an example of what the pane will look like:
then this information is displayed in that pane. The display pane will say 'Code Browser' edgewise on this pane. Here is an example of what the pane will look like:
BUT sometimes even in this mode, I see fly-out informational boxes, I think for errors or warnings in code.
button
(Not sure how this works. Sometimes it provides a sub menu.)
/ button
This is a toggle. If it's high lighted then it keeps the information from further getting updated by mouse movement.
What gets displayed
Depending on your cursor position in your file, this tool shows information and related links. (or at least this is how it seems to work)
For example (...and this list below is possibly incomplete!!, so if you know more of what this tool does, please edit this wiki and add that here.):
- If you are on an #include line,
- it shows information about the file you are including such as what classes are declared in that file.
- If you are on an empty line at file scope,
- it shows the classes and functions declared and defined in the current header file (all as links: clicking on them brings you to the point in the file where the declaration or definition actually is);
- If you are in a function definition,
- it shows where the declaration is and offers a list of places where the function is used.


