Besides debugging, reading through and writing source code is what you will spend the most time with when developing software. To this end, KDevelop offers you many different ways to explore source codes and to make writing it more productive. As discussed in more detail in the following sections, KDevelop is not just a source editor — rather, it is a source management system that gives you different views of extracted information on the files that collectively make up your session's source code.
Tools and views
In order to work with projects, KDevelop has the concept of tools. A tool provides a particular view of the source or an action that can be taken with it. Tools are represented by buttons around the perimeter of your window (in the vertical text along the left and right margins, or horizontally along the bottom margin). If you click on them, they expand to a subwindow — a view — within the main window; if you click on the tool button again, the subwindow disappears again.
Note
To make a subwindow disappear, you can also click at the x at the top right (or top left in for tools at the bottom margin) of the subwindow.
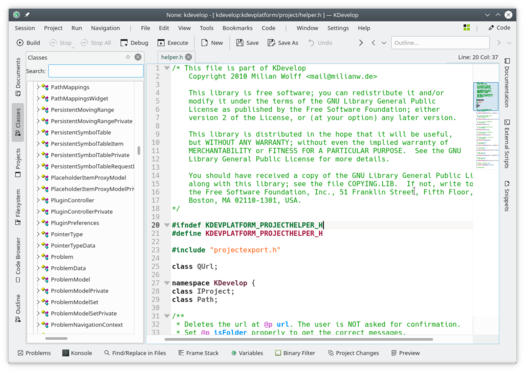
The picture above shows a particular selection of tools, aligned on the left, right and bottom margins; in the picture, the Classes tool is open on the left and the Snippets tool on the right, along with an editor for a source file in the middle. In practice, most of the time you will probably only have the editor and maybe the Classes or Code Browser tool open at the left. Other tool views will likely only be open temporarily as you use the tool, leaving more space for the editor most of the time.
When you run KDevelop the first time, you should already have the Projects tool button. Click on it: it will open a subwindow that shows the build sequence at the bottom, and a file system view of the directories of your projects at the top.
There are many other tools you can use with KDevelop, not all of which are initially present as buttons on the perimeter. To add some, go to the Windows -> Add tool view menu entry which opens a dialog box allowing you to choose the desired tool view. A popup list is shown if you right-click on the left/bottom/right that allows you to choose a tool view as well as the side to place it on. Here are some that you will likely find useful:
Classes: A complete list of all classes that are defined in one of the projects or your session with all of their member functions and variables. Clicking on any of the members opens a source editor window at the location of the item you clicked on.
Documents: Lists the currently open files in the editor.
Code Browser: Depending on your cursor position in a file, this tool shows things that are related. For example, if you are on an #include line, it shows information about the file you are including such as what classes are declared in that file. If you are on an empty line at file scope, it shows the classes and functions declared and defined in the current header file (all as links: clicking on them brings you to the point in the file where the declaration or definition actually is); if you are in a function definition, it shows where the declaration is and offers a list of places where the function is used.
File system: Shows you a tree view of the computer file system.
Documentation: Allows you to search for man pages and other help documents such as c++, qt, php, etc.
Snippets: This provides sequences of text that one uses over and over and doesn't want to type repeatedly. For example, in the project from which the picture above was created, there is a frequent need to write code like:
The code segment will look exactly like this every time you need to use such a segment of code — which would make it a good candidate for a snippet.
Konsole: Opens a command line window inside KDevelop's main window, for the occasional command you may want to enter (e.g. to run ./configure).
For many programmers, vertical screen space is the most important. To this end, you can arrange your tool views at the left and right margin of the window: to move a tool, click on its symbol with the right mouse button and select a new position for it.
Exploring source code
Local information
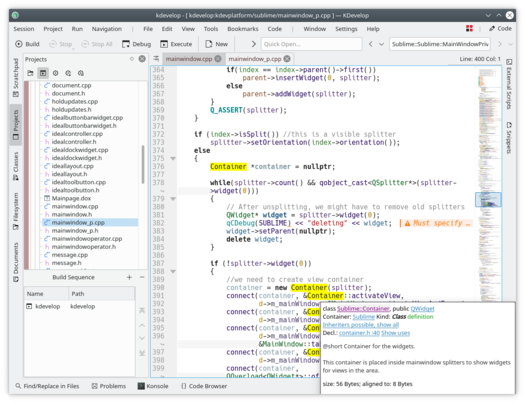
KDevelopunderstands source code, and as a consequence, it is really good at providing you information about variables or functions that may appear in your program. For example, here is a snapshot of working with a piece of code and hovering the mouse over the symbol container in line 390 (if you are working keyboard-oriented, you can achieve the same effect by holding down the Alt key for a while):
KDevelop shows me a tooltip that includes the type of the variable container, where this variable is declared (the container, which
here is in the surrounding function operator()(AreaIndex *index)), what it is (a variable, not a function, class or namespace) and where it is declared (in line 376, just a few lines up in the code).
In the current context, the symbol over which the mouse was hovering, has no associated documentation. In this example, had the mouse hovered over the symbol Container in line 376, the outcome would have been this:
Here, KDevelop has cross-referenced the declaration from an entirely different file (container.h, which resides in the same project of the same session) together with the doxygen-style comment that accompanies the declaration there.
What makes these tooltips even more useful is that they are dynamic: I can click on the container to get information about the context in which the variable is declared (i.e. about the namespace Sublime, such as where it is declared, defined, used, or what its documentation is) and I can click on the blue links that will reset the cursor position to the location of the declaration of the Symbol (e.g. in container.h, line 40) or give me a list of places where this symbol is used in the current file or throughout all the projects of the current session. The latter is often useful if you want to explore how, for example, a particular function is used in a large code basis.
Note
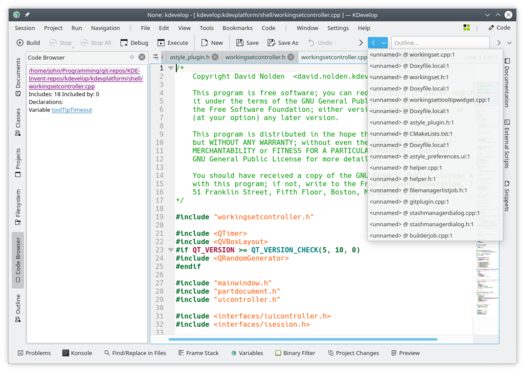
The information in a tooltip is fleeting — it depends on you holding the Alt key down or hovering your mouse. If you want a more permanent place for it, open the Code Browser tool view in one of the sub-windows. For example, here the cursor is on the same function as in the example above, and the tool view on the left presents the same kind of information as in the tooltip before:
Moving the cursor around on the right changes the information presented on the left. What's more, clicking on the Lock current view button at the top right allows you to lock this information, making it independent of the cursor movement while you explore the information presented there.
Note
This sort of context information is available in many other places in KDevelop, not just in the source editor. For example, holding down the Alt key in a completion list (e.g. when doing a quick-open) also yields context information about the current symbol.
File scope information
The next level up is to obtain information about the entire source file you are currently working on. To this end, position the cursor at file scope in the current file and look at the what the Code Browser tool view shows:
Here, it shows a list of namespaces, classes and functions declared or defined in the current file, giving you an overview of what's happening in this file and a means to jump directly to any of these declarations or definitions without scrolling up and down in the file or searching for a particular symbol.
Project and session scope information
There are many ways to obtain information about an entire project (or, in fact, about all projects in a session). This sort of information is typically provided through various tool views. For example, the Classes tool view provides a tree structure of all classes and surrounding namespaces for all projects in a session, together with the member functions and variables of each of these classes:
Hovering over an entry provides again information about the symbol, its location of declaration and definition, and its uses. Double-clicking on an entry in this tree view opens an editor window at the location where the symbol is declared or defined.
But there are other ways of looking at global information. For example, the Documents tool provides a view of the documents that are
open and allows selection of one to view and move easily from one to another:
You can also select the little box of four cubes in the upper right corner to get a list of the open files, termed the working set. Each line starts with a checkable cube that removes the file from the working set when checked. You also have a button on the right side that when pressed, allows you to do a git stash. Useful when you need to change to a different branch or a totally different project.
Rainbow color highlighting explained
KDevelop uses a variety of colors to highlight different objects in source code. If you know what the different colors mean, you can very quickly extract a lot of information from source code just by looking at the colors, without reading a single character. The highlighting rules are as follows:
Objects of type Class / Struct, Enum (the values and the type), (global) functions, and class members each have their own color assigned (classes are green, enums are dark red, and members are dark yellow or violet, (global) functions are always violet).
All global variables are colored in dark green.
Identifiers which are typedefs for another type are colored in teal.
All declarations and definitions of objects are in bold.
If a member is accessed from within the context where it is defined (base or derived class) it appears in yellow, otherwise it appears in violet.
If a member is private or protected, it gets colored in a slightly darker color when used.
For variables local to a function body scope, rainbow colors are picked based on a hash of the identifier. This includes the parameters to the function. An identifier always will have the same color within its scope (but the same identifier will get a different color if it represents a different object, i.e. if it is redefined in a more nested scope), and you will usually get the same color for the same identifier name in different scopes. Thus, if you have multiple functions taking parameters with the same names, the arguments will all look the same color-wise. These rainbow colors can be turned off separately from the global coloring in the settings dialog.
Identifiers for which KDevelop could not determine the corresponding declaration are colored in white. This can sometimes be caused by missing #include directives.
In addition to that coloring, the normal editor syntax highlighting will be applied, as known from Kate. KDevelop's semantic highlighting will always override the editor highlighting if there is a conflict.
Navigating in source code
In the previous section, we have discussed exploring source code, i.e. getting information about symbols, files and projects. The next step is then to jump around your source base, i.e. to navigate in it. There are again various levels at which this is possible: local, within a file, and within a project.
Note
Many of the ways to navigate through code are accessible from the Navigate menu in the KDevelop main window.
Local navigation
KDevelop is much more than an editor, but it is also a source editor. As such, you can, of course, move the cursor up, down, left or right in a source file. You can also use the PageUp and PageDown keys, and all the other commands you are used from any useful editor.
File scope navigation and outline mode
At the file scope, KDevelop offers many possible ways to navigate through source code. For example:
Outline: You can get an outline of what is in the current file in at least three different ways:
Clicking on the OutlineTool View button that is generally located on the left border.There is a button to sort everything in ascending or descending order and a filter edit box. You can then just select which one to jump to, or — if there are a lot — start typing any text that may appear in the names shown in the filter edit box. In that case, as you keep typing, the list becomes smaller and smaller as names are removed that don't match the text already typed until you are ready to select one of the choices.
Hot-keys Alt + Ctrl + N opens a dialog box that lists all function and class declarations.This also provides you with an outline of what is happening in the current file, allows you to search if the list is long, and allows you to select where you want to jump to.
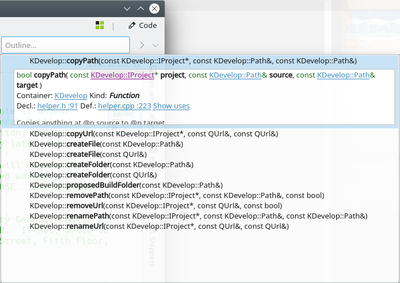
The code browser toolbar has a line edit in the toolbar that you can type in a function or class name to quickly find it, or just click in the line edit and it shows an outline. If an item in the pop-up is clicked, you get the tooltip for the item with information and links about its definition and usage.
Source files are organized as a list of function declarations or definitions. Hitting Alt + Ctrl + PgUp and Alt + Ctrl + PgDown jumps to the previous or next function definition in this file.
Project and session scope navigation: Semantic navigation
As mentioned in other places, KDevelop does not usually consider individual source files but rather looks at projects as a whole (or, rather, at all projects that are part of the current session). As a consequence, it offers many possibilities for navigating through entire projects. Some of these are derived from what we have already discussed in the section on Exploring source code while others are genuinely different. The common theme is that these navigation features are based on a semantic understanding of the code, i.e. they offer you something that requires parsing entire projects and connecting data. The following list shows some ways how to navigate through source code that is scattered throughout a potentially very large number of files:
As seen in the section on Exploring source code, you can get a tooltip explaining individual namespace, class, function or variable names by hovering your mouse over it or keeping the Alt key pressed for a while. Here is an example: Clicking on the links for the declaration of a symbol or expanding the list of uses allows you to jump to these locations, if necessary opening the respective file and placing the cursor at the corresponding location. A similar effect can be achieved by using the Code Browser tool view also discussed previously.
Quick open: A very powerful way of jumping to other files or locations is to use the various quick open methods in KDevelop. There are four versions of these:
Quick open class (Navigate -> Quick open class or Alt + Ctrl + C): You will get a list of all classes in this session. Start typing (a part of) the name of a class and the list will continue to whittle down to only those that actually match what you've typed so far. If the list is short enough, select an element using the up and down keys and KDevelop will get you to the place where the class is declared.
Quick open function (Navigate -> Quick open function or Alt + Ctrl + M): You will get a list of all (member) functions that are part of the projects in the current session, and you can select from it in the same way as above. Note that this list may include both function declarations and definitions.
Quick open file (Navigate -> Quick open file or Alt + Ctrl + O): You will get a list of all files that are part of the projects in the current session, and you can select from it in the same way as above.
Universal quick open (Navigate -> Quick open or Alt + Ctrl + Q): If you forget which key combination is bound to which of the above commands, this is the universal swiss army knife — it simply presents you with a combined list of all files, functions, classes, and other things from which you can select.
Jump to declaration/definition: When implementing a (member) function, one often needs to switch back to the point where a function is declared, for example to keep the list of function arguments synchronised between declaration and definition, or to update the documentation. To do so, place the cursor onto the function name and select Navigation -> Jump to declaration (or hit Ctrl + .) to get to the place where the function is declared. There are multiple ways to get back to the original place:
Selecting Navigation -> Previous visited context (or hit Meta + Left), as described below.
Note
Jumping to the declaration of a symbol is something that does not only work when placing the cursor on the name of the function you are currently implementing. Rather, it also works for other symbols: Putting the cursor on a (local, global, or member) variable and jumping to its declaration also transports you to its location of declaration. Similarly, you can place the cursor on the name of a class, for example in a variable of function declaration, and jump to the location of its declaration.
Switch between declaration/definition: In the example above, to jump to the site of the declaration of the current function, you need to first place the cursor on the function name. To avoid this step, you can select Navigation -> Switch definition/declaration (or hit Shift + Ctrl + C) to jump to the declaration of the function within which the cursor currently is. Selecting the same menu entry a second time transports you back to the place where the function is defined.
Previous/Next use: Placing the cursor on the name of a local variable and selecting Navigation -> Next use (or hitting Meta + Shift + Right) transports you to the next use of this variable in the code. (Note that this doesn't just search for the next occurrence of the variable name but in fact takes into account that variables with the same name but in different scopes are different.) The same works for the use of function names. Selecting Navigation -> Previous use (or hitting Meta + Shift + Left) transports you to the previous use of a symbol.
Note
To see the list of all uses of a name through which these commands cycle, place the cursor onto it and open the Code Browser tool view or press and hold the Alt button. This is explained in more detail in the section on Exploring code.
The context list: Web browsers have this feature where you can go backward and forward in the list of most recently visited web pages. KDevelop has the same kind of features, except that instead of web pages you visit contexts. A context is the current location of the cursor, and you change it by navigating away from it using anything but cursor commands — for example, by clicking on a location provided by a tooltip, in the Code Browser tool view, one of the options given in the Navigation menu, or any other navigation command. Using the Navigation -> Previous Visited Context (Meta + Left) and Navigation -> Next Visited Context (Meta + Right) transports you along this list of visited contexts just like the back and forward buttons of a browser transports you to the previous or next webpage in the list of visited pages. You can also use the code browser toolbar that gives you the option to click the left arrow to go backwards to a previous file and line number, or choose the down arrow that provides a pop-up list of previous files and line number to be chosen.
Finally, there are tool views that allow you to navigate to different places in your codebase. For example, the Classes tool provides you with a list of all namespaces and classes in all projects of the current session, and allows you to expand it to see member functions and variables of each of these classes: Double-clicking on an item (or going through the context menu using the right mouse button) allows you to jump to the location of the declaration of the item. Other tools allow similar things; for example, the Projects tool view provides a list of files that are part of a session: Again, double-clicking on a file opens it.
Writing source code
Because KDevelop understands your projects' source code, it can assist in writing more code. The following outlines some of the ways in which it does that.
Auto-completion
Probably the most useful of all features in writing new code is auto-completion. Consider, for example, the following piece of code:
classCar{// ...public:std::stringget_color()const;};voidfoo(){Carmy_ride;// ...do something with this variable...std::stringcolor=my_ride.ge
In the last line, KDevelop will remember that the variable my_ride is of type Car, and will automatically offer to complete the name of the member function ge as get_color. In fact, all you have to do is to keep typing until the auto-completion feature has reduced the number of matches to one, and then hit the Enter key:
Note that you can click on the tool-tip to get more information about the function apart from its return type and whether it is public:
Auto-completion can save you a lot of typing if your project uses long variable and function names; furthermore, it avoids mis-spelling names (and the resulting compiler errors) and it makes it much simpler to remember the exact names of functions. For example, if all of your getters start with get_, then the auto-completion feature will be able to only present you a list of possible getters when you have typed the first four letters, likely reminding you in the process which of the functions is the correct one. Note that for auto-completion to work, neither the declaration of the Car class nor of the my_ride variable need to be in the same file as where you are currently writing code. KDevelop simply has to know that these classes and variables are connected, i.e. the files in which these connections are made need to be part of the project you are currently working on.
Note
KDevelop doesn't always know when to assist you in completing code. If the auto-completion tooltip doesn't automatically open, hit Ctrl + Space to open a list of completions manually. In general, in order for auto-completion to work, KDevelop needs to parse your source files. This happens in the background for all files that are part of the projects of the current session after you start KDevelop, as well as while after you stop typing for a fraction of a second (the delay can be configured).
Note
KDevelop only parses files that it considers source code, as determined by the MIME-type of the file. This type isn't set before the first time a file is saved; consequently, creating a new file and starting to write code in it will not trigger parsing for auto-completion or code highlighting until after it is saved for the first time.
Note
As in the previous note, for auto-completion to work, KDevelop must be able to find declarations in header files. For this, it searches in a number of default paths. If it doesn't automatically find a header file, it will underline the name of a header file in red; in that case, right-click on it to tell KDevelop explicitly where to find these files and the information they provide.
Adding new classes and implementing member functions
KDevelop has an assistant for adding new classes. The procedure is described in Creating a new class. A simple C++ class can be created by choosing the Basic C++ template from the Class category. In the assistant, we can choose some predefined member functions, for example, an empty constructor, a copy constructor and a destructor.
After completing the assistant, the new files are created and opened in the editor. The header file already has include guards and the new class has all the member functions we selected. The next two steps would be to document the class and its member functions and to implement them. We will discuss aids for documenting classes and functions below. To implement the special functions already added, simply go to the bus.cpp tab where the skeleton of functions is already provided:
To add new member functions, go back to the bus.h tab and add the name of a function. For example, let us add this:
Note how I have already started with the implementation. However, in many coding styles, the function shouldn't be implemented in the header file but rather in the corresponding .cpp file. To this end, locate the cursor on the name of the function and select Code -> Move to source or hit Ctrl + Alt + S. This removes the code between curly braces from the header file (and replaces it by a semicolon as necessary to terminate the function declaration) and moves it into the source file:
Note how I have just started typing and that I meant to imply that the students variable should probably be a member variable of class Bus but that I haven't yet added it. Note also how KDevelop underlines it to make clear that it doesn't know anything about the variable. But this problem can be solved: Clicking on the variable name yields the following tooltip:
As a final point: The method using Code -> Move to source does not always insert the new member function where you may want it. For example, you may want it to be marked as inline and place it at the bottom of the header file. In a case like this, write the declaration and the start writing the definition of the function like this:
Documenting declarations
Good code is well documented, both at the level of the implementation of algorithms within in functions as well as at the level of the interface — i.e., classes, (member and global) functions, and (member or global) variables need to be documented to explain their intent, possible values of arguments, pre- and postconditions, etc. As far as documenting the interface is concerned, doxygen has become the de facto standard for formatting comments that can then be extracted and displayed on searchable webpages.
KDevelop supports this style of comments by providing a short cut to generate the framework of comments that document a class or member function. For example, assume you have already written this code:
classCar{public:std::stringget_color()const;};
You now want to add documentation to both the class and the member function. To this end, move the cursor onto the first line and select Code -> Document Declaration or hit Alt + Shift + D. KDevelop will respond with the following:
The cursor is already in the grayed out area for you to fill in the short description (after the doxygen keyword @brief) of this class. You can then continue to add documentation to this comment that gives a more detailed overview of what the class does:
When you get to the end of a line, hit Enter and KDevelop will automatically start a new line that starts with an asterisk and indent the cursor by one character. After documenting an item and Enter is hit outside of the documentation area, the gray highlight is removed.
Now let's document the member function, again by putting the cursor on the line of the declaration and selecting Code -> Document Declaration or hitting Alt + Shift + D:
Again, KDevelop automatically generates the skeleton of comment, including documentation for the function itself, as well as its return type. In the current case, the name of the function is pretty much self-explanatory, but oftentimes function arguments may not be and should be documented individually. To illustrate this, let's consider a slightly more interesting function and the comment KDevelop automatically generates:
Here, the suggested comment already contains all the Doxygen fields for the individual parameters, for example.
Renaming variables, functions and classes
Sometimes, one wants to rename a function, class or variable. For example, let's say we already have this:
We then realize that we're unhappy with the name remove_students and would have rather called it, say, throw_out_students. We could do a search-replace for the name, but this has two drawbacks:
The function may be used in more than one file.
We really only want to rename this function and not touch functions that may have the same name but are declared in other classes or namespaces.
Both these problems can be solved by moving the cursor on any of the occurrences of the name of the function and selecting Code -> Rename declaration (or right-clicking on the name and selecting Rename Bus::remove_students). This brings up a dialog box where you can enter the new name of the function and where you can also see all the places where the function is actually used:
Code snippets
Most projects have pieces of code that one frequently has to write in source code. Examples are: for compiler writers, a loop over all instructions; for user interface writers, checks that user input is valid and if not to open an error box; in the project of the author of these lines, it would be code of the kind
Rather than typing this kind of text over and over again (with all the concomitant typos one introduces), the Snippets tool of KDevelop can help here. To this end, open the tool view (see Tools and views if the corresponding button isn't already on the perimeter of your window). Or, go to Window -> Tool views in the top menubar, and turn on Snippets. Then click on the Add repositorybutton (a slight misnomer — it allows you to create a named collection of snippets for source codes of a particular kind, e.g. C++ sources) and create an empty repository. Then click Add Snippet to add a snippet, to get a dialog like the following:
If no snippet repository has been created yet and your project is based on C++, Using the menu choice Tools -> Create Snippet creates a repository named ISO C++ snippets and puts your snippets in it as shown above. To the right of the Create Snippet dialog box is a view of the snippets tool view showing the snippets available for use.
Note
The name of a snippet may not have spaces or other special characters because it must look like a normal function or variable name (for reasons that will become clear in the next paragraph).
To use a snippet already defined when you are editing code, just type the name of the snippet like you would any other function or variable name. This name will become available for auto-completion — which means that there is no harm in using a long and descriptive name for a snippet such as the one above — and when you accept the suggestion of the auto-completion tooltip (for example by just hitting Enter), the already entered part of the snippets' name will be replaced by the full expansion of the snippet and will be properly indented:
Note that for this to work, the Snippets tool view need not be open or visible. An alternative way to insert a snippet is to simply click on it in the snippet tool view. By hovering the mouse over the snippet, it gives you a view of the code in the snippet.
If you've gotten this far, take a look at the upper right of the KDevelop main window you will see a code button. When the button is pushed, you will see that there are two options offered: Commit Current Project... (see Working with version control systems) and Debug (see Debugging programs).
Each mode has its own set of tools that are stacked around the perimeter, and each mode also has a working set of currently open files and documents. Furthermore, each such working set is associated with a current session, i.e. we have the relationship shown above. Note that the files in the working set come from the same session, but they may come from different projects that are part of the same session.
If you open KDevelop the first time, the working set is empty — there are no open files. But as you open files for editing (or debugging, or reviewing in the other modes) your working set grows. You will notice that whenever you close KDevelop and later start it again, the working set is saved and restored, i.e. you get the same set of open files.
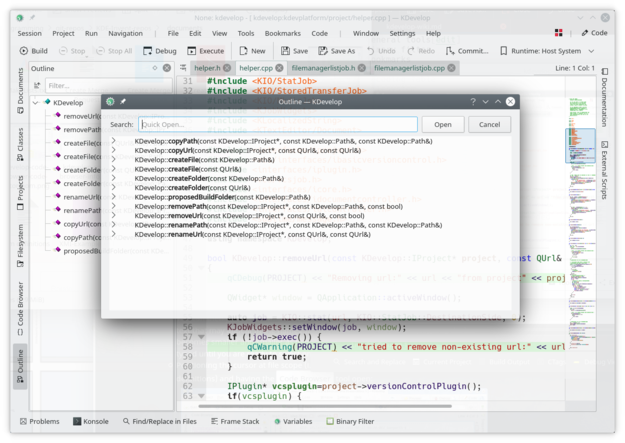
If you hover your mouse over the symbol for the working set, you get a tooltip that shows you which files are currently open in this working set (here: the helper.h, helper.cpp, filemanagerlistjob.h and filemanagerlistjob.cpp files). The working set icon can have different colors at different times in it, but they have no specific meaning. Clicking on the square with a minus sign closes the tab for the corresponding file in the working set. The point about closing a working set, however, is that it doesn't just close all files, it actually prompts you to save the file if any are changed but not saved and opens a new, still empty one.
Some useful keyboard shortcuts
KDevelop's editor follows the standard keyboard shortcuts for all usual editing operations, that can be configured as you desire.
There is an option to configure and save different shortcut schemes, where you can also export or import any of your schemes.
However, it also supports a number of more advanced operations when editing source code, some of which are bound to particular key combinations. The following are frequently particularly helpful:
Jumping around in code
Ctrl+Alt+O
Quick open file: enter part of a filename and select among all the files in the current session's projects' directory trees that match the string; the file will then be opened
Ctrl+Alt+C
Quick open class: enter part of a class name and select among all class names that match; the cursor will then jump to the class declaration
Ctrl+Alt+M
Quick open function: enter part of a (member) function name and select among all names that match; note that the list shows both declarations and definitions and the cursor will then jump to the selected item
Ctrl+Alt+Q
Universal quick open: type anything (file name, class name, function name) and get a list of anything that matches to select from
Ctrl+Alt+N
Outline: Provide a list of all things that are happening in this file, e.g. class declarations and function definitions
Ctrl+,
Jump to definition of a function if the cursor is currently on a function declaration
Ctrl+.
Jump to declaration of a function or variable if the cursor is currently in a function definition
Ctrl+Alt+PageDown
Jump to next function
Ctrl+Alt+PageUp
Jump to previous function
Ctrl+G
Goto line
Searching and replacing
Ctrl+F
Find
F3
Find next
Ctrl+R
Replace
Ctrl+Alt+F
Find-Replace in multiple files
Other things
Ctrl+_
Collapse one level: remove this block from view, for example if you want to focus on the bigger picture within a function
Ctrl++
Expand one level: undo the collapsing
Ctrl+D
Comment out selected text or current line
Ctrl+Shift+D
Comment in selected text or current line
Alt+Shift+D
Document the current function. If the cursor is on a function or class declaration then hitting this key will create a doxygen-style comment pre-populated with a listing of all parameters, return values, etc.
Ctrl+T
Transpose the current and the previous character
Ctrl+K
Delete the current line (note: this is not just emacs' "delete from here to the end of the line")