Kdenlive/Manual/Effects/Misc/pr0file: Difference between revisions
No edit summary |
|||
| Line 6: | Line 6: | ||
* together with test charts, measure the spatial frequency response | * together with test charts, measure the spatial frequency response | ||
* etc. | * etc. | ||
[[File:Kdenlive Pr0file.png]] | |||
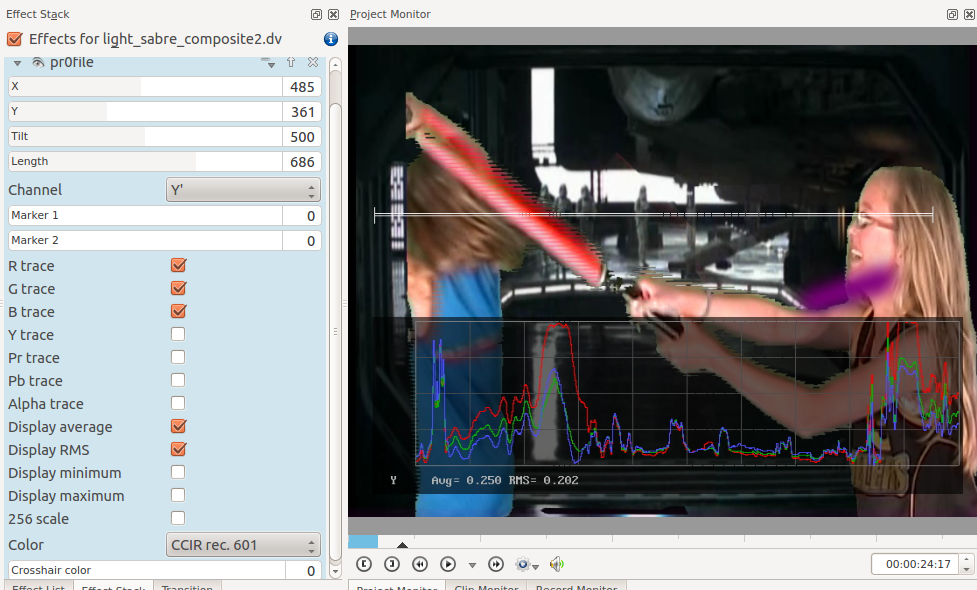
The position, size and direction of the profile can be set with the X, Y, Tilt and Length parameters. | The position, size and direction of the profile can be set with the X, Y, Tilt and Length parameters. | ||
Latest revision as of 10:23, 28 February 2013
Pr0file
This is a measurement tool, not an effect. It is like an video oscilloscope, that can show the profile along any direction in the image. It can be used for things like:
- fine tuning of sharpening / unsharp masking
- identify color subsampling
- together with test charts, measure the spatial frequency response
- etc.
The position, size and direction of the profile can be set with the X, Y, Tilt and Length parameters.
The "Channel" parameter selects what will be displayed in the numerical readout.
Two markers can be set on the profile, to select individual values for the readout.
The next seven checkboxes select the channels to be drawn on the graph.
Next, there are four checkboxes which determine what statistics will be displayed numerically.
If "256 scale" is checked, values are displayed as 0...255 integers, otherwise they are displayed as 0...1 floating point numbers.
The "color" parameter selects whether rec 601 or rec 709 formulas will be used for the luma and chroma calculation.


