LabPlot: Difference between revisions
(Created minimal page - no real content yet) |
m (minor fix) |
||
| (One intermediate revision by one other user not shown) | |||
| Line 2: | Line 2: | ||
<translate> | <translate> | ||
<!--T:1--> | |||
{|class="tablecenter vertical-centered" | {|class="tablecenter vertical-centered" | ||
| [[Image:LabPlot.png|64px]] | | [[Image:LabPlot.png|64px]] | ||
| '''LabPlot''' is an application for interactive graphing and analysis of scientific data. '''LabPlot''' provides an easy way to create, manage and edit plots and to perform data analysis | | '''LabPlot''' is an application for interactive graphing and analysis of scientific data. '''LabPlot''' provides an easy way to create, manage and edit plots and to perform data analysis. | ||
|} | |} | ||
<!--T:2--> | |||
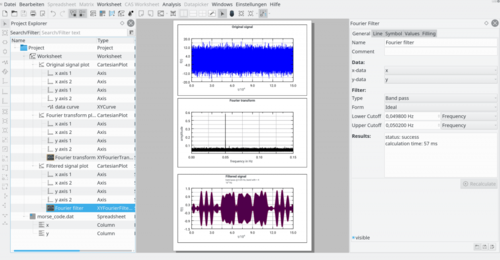
[[Image:LabPlot Fourier filter example-1024x532.png|500px|thumb|center]] | [[Image:LabPlot Fourier filter example-1024x532.png|500px|thumb|center]] | ||
<!--T:3--> | |||
The LabPlot web page is [https://labplot.kde.org here]. | The LabPlot web page is [https://labplot.kde.org here]. | ||
<!--T:4--> | |||
[[Category:Science]] | [[Category:Science]] | ||
</translate> | </translate> | ||
Revision as of 12:21, 1 May 2017

|
LabPlot is an application for interactive graphing and analysis of scientific data. LabPlot provides an easy way to create, manage and edit plots and to perform data analysis. |

The LabPlot web page is here.
