Kdenlive/Manual/View Menu/Spectogram
Appearance
Spectrogram
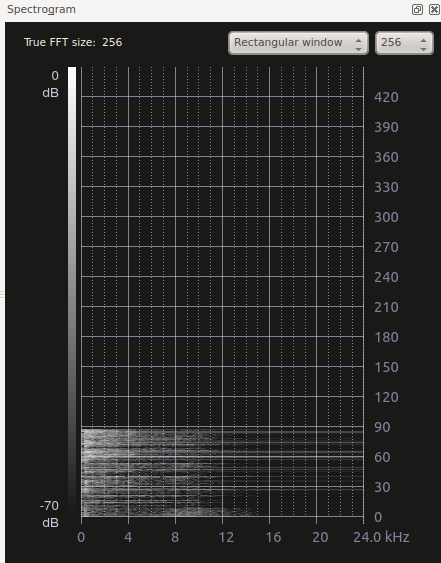
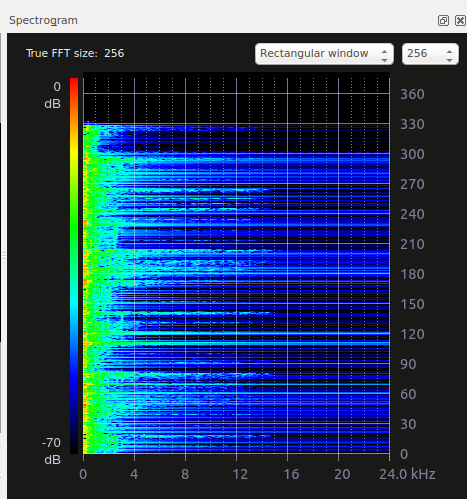
This allows you to monitor the audio properties of your clip in detail. The spectrogram displays the loudness (in decibels) of the audio at different audio frequencies over the entire length of the clip. In the spectrogram, the horizontal axis represents the audio frequency and the loudness is represented by the brightness (versions <= 0.9.8) or the colour (versions >= 0.9.10) of the pixel on the graph. The vertical axis represents frame number.


For more information see Granjow's blog on Spectogram
