LabPlot/da: Difference between revisions
Appearance
Created page with "== Dokumentation == * Kom i gang * Brugervejledning * Special:myLanguage/LabPlot/Tutor..." |
No edit summary |
||
| (2 intermediate revisions by 2 users not shown) | |||
| Line 28: | Line 28: | ||
== Yderligere information == | == Yderligere information == | ||
* [https://labplot.kde.org LabPlots hjemmeside] | * [https://labplot.kde.org LabPlots hjemmeside] | ||
* [https:// | * [https://twitter.com/LabPlot Twitter] | ||
</ | * [https://www.youtube.com/channel/UCoxs-QOKb4SdIk4TMbrTzlQ YouTube] | ||
* Wikipedia (engelsk) | |||
** [https://en.wikipedia.org/wiki/LabPlot Hovedartikel] | |||
** [https://en.wikipedia.org/wiki/List_of_information_graphics_software List of information graphics software] | |||
** [https://en.wikipedia.org/wiki/Comparison_of_numerical-analysis_software Comparison of numerical-analysis software] | |||
* For at citere LabPlot i publikationer brug (se også [https://guides.libraries.uc.edu/citing/code "Citing computer code in a report or paper"]): | |||
<source> | |||
LabPlot Team (2022), LabPlot: A FREE, open source, cross-platform Data Visualization and Analysis software accessible to everyone, | |||
(Version 2.9) [Computer software]. https://labplot.kde.org. | |||
</source> | |||
[[Category:Videnskab/da]] | [[Category:Videnskab/da]] | ||
Latest revision as of 14:30, 3 October 2022

|
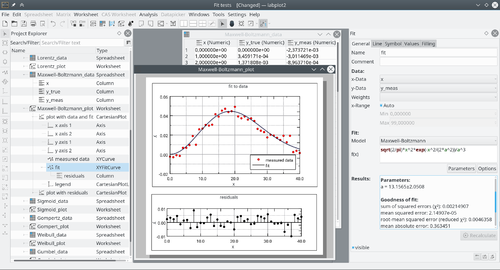
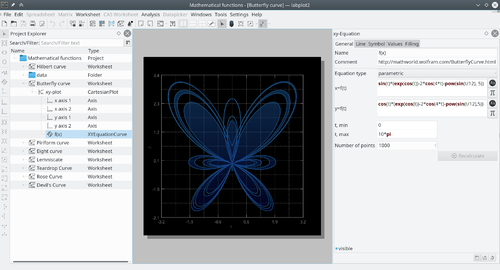
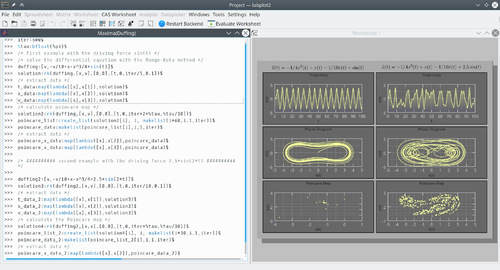
LabPlot er et program, som laver grafer og analyserer videnskabelige data interaktivt. LabPlot giver dig en nem måde at lave, håndtere og redigere plots og udføre dataanalyse. |
Introduktion
LabPlot understøtter 2d-plotning, dataanalyse (fx Fouriertransformation, lineær og ikke-lineær regressionsanalyse), beregning med et computer algebra system (CAS) som Maxima og GNU Octave og import og eksport af mange formater.
En fuld liste af LabPlots funktioner findes på LabPlots hjemmeside.
Skærmbilleder


Flere skærmbilleder kan ses på LabPlots hjemmeside
Dokumentation
Yderligere information
- LabPlots hjemmeside
- YouTube
- Wikipedia (engelsk)
- For at citere LabPlot i publikationer brug (se også "Citing computer code in a report or paper"):
      LabPlot Team (2022), LabPlot: A FREE, open source, cross-platform Data Visualization and Analysis software accessible to everyone,
      (Version  2.9) [Computer software]. https://labplot.kde.org.