Kdenlive/Manual/View Menu/RGB Parade: Difference between revisions
Appearance
| Line 1: | Line 1: | ||
== RGB Parade == | == RGB Parade == | ||
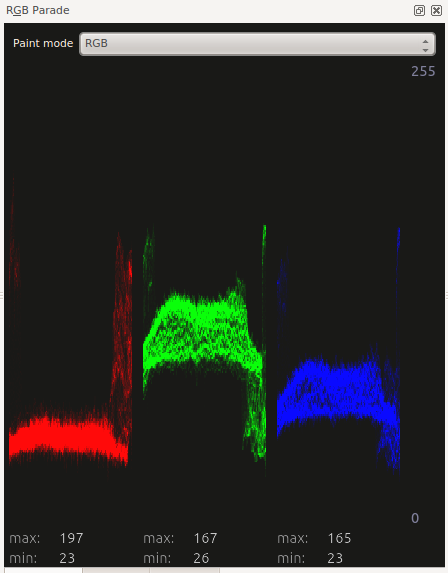
Display a histogram of R, G and B components of the video data. | Display a histogram of R, G and B components of the video data. This data is a 3D histogram. | ||
The horizonal axis represents the horizonal axis in the video frame. The vertical axis is the pixel luminance from 0 to 255. The brightness of the point on the graph represents the count of the number of pixels with this luminance in this column of pixels in the video frame. | |||
[[File:Rgb parade.png]] | [[File:Rgb parade.png]] | ||
For more information see [http://kdenlive.org/users/granjow/introducing-color-scopes-waveform-and-rgb-parade Granjow's blog] on the waveform and RGB parade scopes. | |||
This somewhat different to the video effect [[Kdenlive/Manual/Effects/Colour/RGB_Parade|RGB Parade]] in that with View>RGB parade the histogram is displayed in the application whereas in the RGB Parade effect the histogram is written into the video output file. | This somewhat different to the video effect [[Kdenlive/Manual/Effects/Colour/RGB_Parade|RGB Parade]] in that with View>RGB parade the histogram is displayed in the application whereas in the RGB Parade effect the histogram is written into the video output file. | ||
Revision as of 13:56, 2 August 2012
RGB Parade
Display a histogram of R, G and B components of the video data. This data is a 3D histogram.
The horizonal axis represents the horizonal axis in the video frame. The vertical axis is the pixel luminance from 0 to 255. The brightness of the point on the graph represents the count of the number of pixels with this luminance in this column of pixels in the video frame.
For more information see Granjow's blog on the waveform and RGB parade scopes.
This somewhat different to the video effect RGB Parade in that with View>RGB parade the histogram is displayed in the application whereas in the RGB Parade effect the histogram is written into the video output file.

