Khipu/Manual/DotKhipuFiles: Difference between revisions
MinSik CHO (talk | contribs) No edit summary |
MinSik CHO (talk | contribs) No edit summary |
||
| Line 1: | Line 1: | ||
=== About .khipu Files === | === About .khipu Files === | ||
Latest revision as of 02:48, 7 January 2014
About .khipu Files
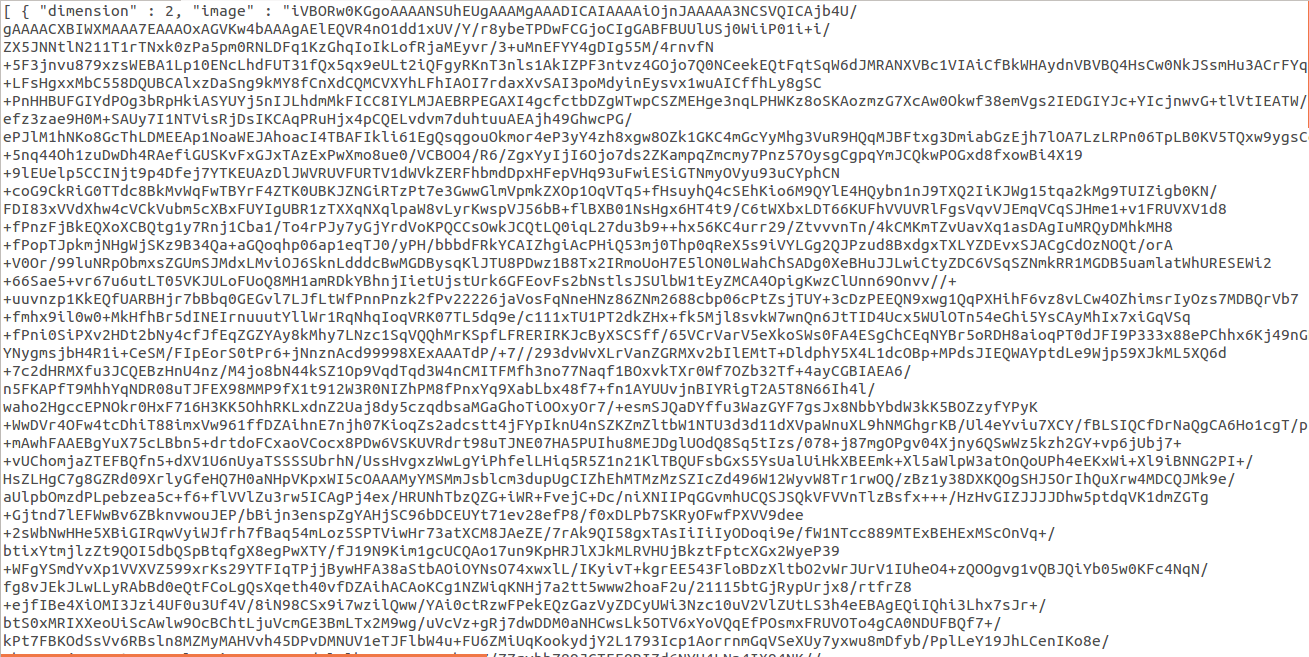
.khipu files are the files that are generated when you save your khipu workspace. The basic syntax of this file is introduced in this document. Note that the structure khipu uses in its persistance file is QJson format.
Sample .khipu File
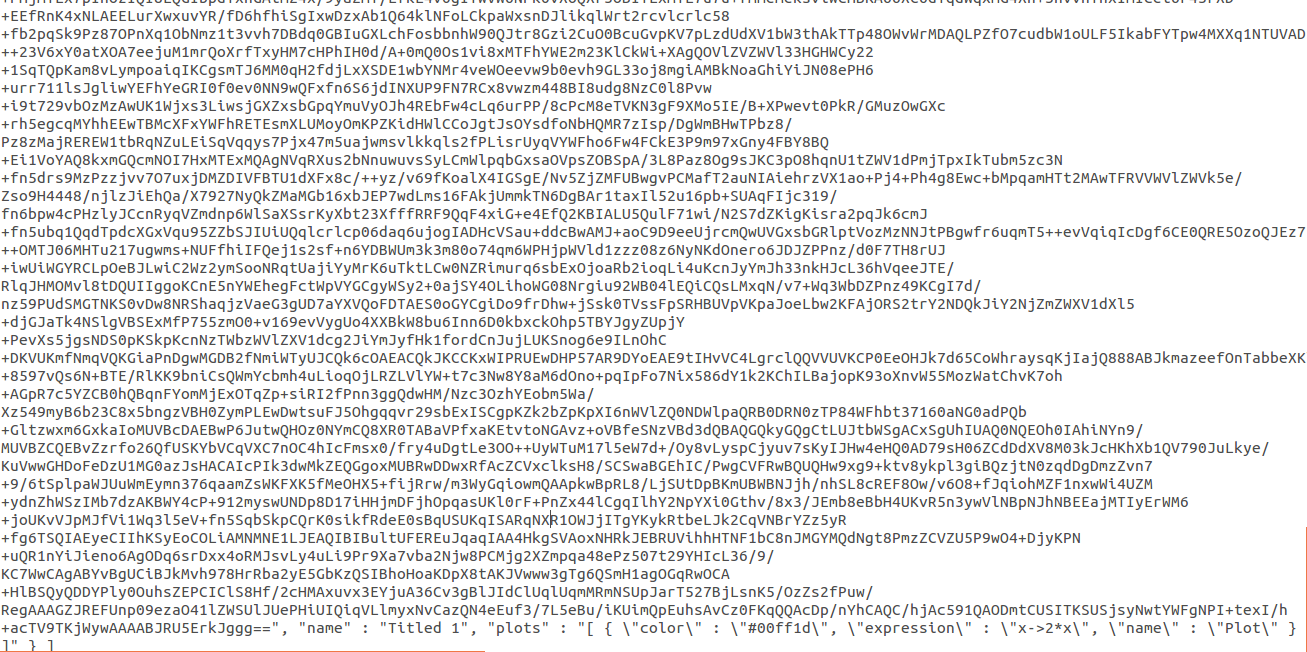
Above is a screenshot of sample .khipu file, opened by gedit. In 2D Space with space-title 'Titled 1' is a y=2x graph drawn in green color, and a name of 'Plot'. The details of this syntax will be explained one by one.
Space
The information about the space comes first. If there are multiple spaces, these information come multiple times, discriminated by {} and comma (,).
Dimension
The first argument that is in .khipu file is 'dimension'.
If your space is in 2D format, the dimension is saved as '2'. If your space is in 3D format, the dimension is saved as '4'.
Image
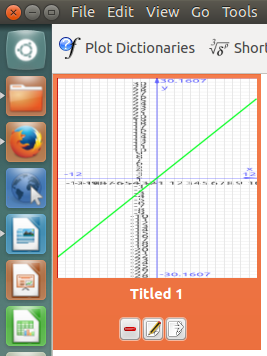
The image part is the biggest chunk in .khipu format. This part essentially contains the information about the thumbnail picture of your space. A thumbnail is the small graph image that shows the part of your space, just like the one shown below.
Name
The name of space is listed after "name".
Graphs
The graphs are listed after the information about the spaces. All graphs are listed in "plots" category. If there are multiple plots, it is listed in the same “plots” argument, using different brackets []. Note that the properties of the graphs itself have \"something\" structure, to discern from space properties.
Intervals
Inside plots, “arg1max” and “arg1min” define the interval the graph is defined. So, for example, if I want to plot between -5 and +5, It would be \”arg1max\” : \”5\”, \"arg1min\" : \"-5\"
Color
The “color” defines what color the graph is plotted. As you might have noticed, it is shown in simple HTML color code.
Expression
“expression” defines what expression is being plotted. It uses grammar of 'analitza', which is our backend library. The syntax of this is quite intuitive: x->sin(x) for example corresponds y=sin(x) graph. It is essentially similar to modern calculators, or math languages.
Name
Finally, "name" defines the name of the graph.
Brackets
Each hierarchy is discerned by different brackets. The first hierarchy (contains info about spaces) uses curly brackets {}. The second hierarchy (contains information about individual graphs - plots) also uses curly brackets {}, but are in all encompassed with square brackets [].
That is, if there are two plots, it is like this:
"plots" : "[ { \"color\" : \"#00ffe6\", \"expression\" : \"(x, y, z)->(x^5+y+z)-8\", \"plot1\" : \"\" } , { \"color\" : \"#00abe8\", \"expression\" : \"(x, y, z)->(x^2+y^2+z^2)-64\", \"plot2\" : \"\" }]"


