Plan/Manual/Task Performance View: Difference between revisions
Appearance
mNo edit summary |
mNo edit summary |
||
| Line 19: | Line 19: | ||
---- | ---- | ||
{| | {{Plan/Prevnext|prevpage=Project Performance View|indextext=Contents|nextpage=Task Status View}} | ||
| | |||
[[Category:Office]] | [[Category:Office]] | ||
Revision as of 06:43, 10 October 2019
Task performance chart
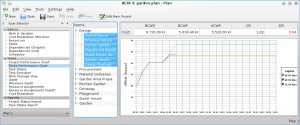
On the task performance chart we can analyze deeply each sub task or task with the same indexes as for the project performance view. This is really useful in long and complicated project
On the left window you can choose each single sub task as well as an entire task, than on the right window will appear the corresponding chart.

where:
- BCWS means Budgeted Cost Work Scheduled,
- BCWP means Budgeted Cost Work Performed,
- ACWP means Actual Cost Work Performed.
All these are considered as effort in hours and costs.
PI are the Performance Indexes, where:
- CPI is the Cost Performance Index,
- SPI is the Schedule Performance Index.
