系統活動
介紹
系統活動近似於Microsoft Window的任務管理器,Apple Mac OS X的活動監視器以及GNOME的系統監視器。按住鍵盤快捷鍵Ctrl + Esc 或點擊 KRunner((Alt + F2))視窗左側的![]() 「系統活動」圖示就會彈出它。
「系統活動」圖示就會彈出它。
它顯示當前運行進程的列表,外帶它們的CPU佔用,記憶體佔用和多種其他部分的信息。
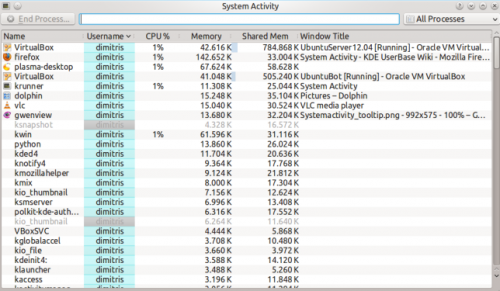
一般提示
幾乎介面每個部分都有工具提示(當你懸停鼠標指針足夠久時)來提供更多詳細信息,“這是什麼功能”(點擊![]() 按鈕激活)解釋信息代表的意思。
按鈕激活)解釋信息代表的意思。
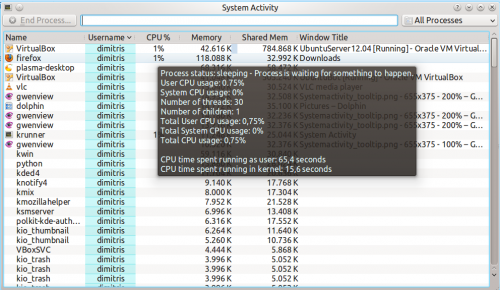
例如,懸停指針到一個進程的CPU使用率上,我們會看到各種其他信息,包括這個程式總共運行了多長時間。
為什麼我當前系統運行的這麼慢?
一個系統會由於某個進程(程式)請求所有電腦處理能力(CPU使用)或占用所有電腦的記憶體而變得異常緩慢。
默認情況下,當前用戶擁有的進程中佔用大量CPU或記憶體的進程會靠近頂部。這意味著異常程式應該是靠近頂部,很容易分辨。舉個例子:
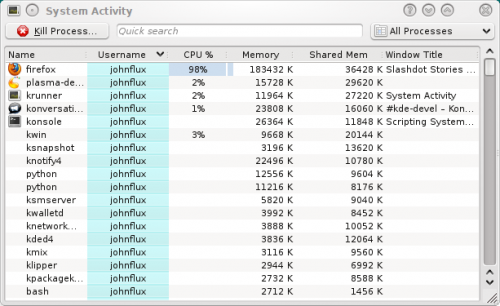
在這個例子中,firefox停止響應並佔用了99%的CPU。要終止這個異常的進程,點擊進程選定它並按下 按鈕。它會發送一個請求(a polite request)給程式,要求它關閉。
我殺不了它 - 它不死!
謝天謝地這種事情很少見,僅僅偶爾你會遇到。如果某個進程異常的話它有可能會忽視你的終止請求,這時我們需要直接強制這個進程終止。這樣做可能會導致這個程式打開的文檔等未保存就關閉。要強制終止,這樣做,右擊進程並選擇“發送信號”,然後選擇。
有時甚至這樣也無法殺掉進程,亦或是根本沒這個操作選項。這種情況在比如使用某些內核時發生。如果進程本身或是進程的某個線程引發內核bug,最終使得其陷入不停的執行內核操作中,便處於完全無法殺掉的狀態。通常除了重啟機子,沒其他解決方法了。
殭屍進程
殭屍狀態的進程已經死了,所以不能被殺死。系統繼續保留它們直到它們的父進程注意到回收它們,通常只需要很短時間。通常看到殭屍進程表明它的父進程已經停止響應了。
選取殺死一個視窗
If you want to kill a particular window that has frozen up, simply press Ctrl + Alt + Esc at any time. The mouse cursor should turn into an image of a skull and cross bones. Now click the window that you want to kill. Note that this will kill the application immediately, and you may lose any unsaved data.
The Memory column shows approximately the amount of memory (RAM) that the process is using by itself, privately. The Shared Memory column is approximately the memory that is, or could be, shared with other programs. For example, the KDE libraries are used by all KDE programs and so are loaded into memory only once.
From KDE SC 4.4, you can right-click on a process and view the for the process to get more accurate readings.
Technical Information
The "Memory" column shows the value of VmRSS - Shared, and so is generally lower than the values shown by top etc. This does not include memory backed I/O pages, and does not include memory used by the x server to store any pixmaps used by the application. This value is often called the Unique RSS size, or URSS. This approximates the value shown as Private memory usage in the .
The Shared memory is the same as the SHR column in top and can be somewhat inaccurate. This approximates the value shown as Shared memory usage in the .
Specifically the process list parses /proc/pid/stat whereas the dialog parses /proc/pid/smaps.
How do I view more Detailed Memory Information about a process?
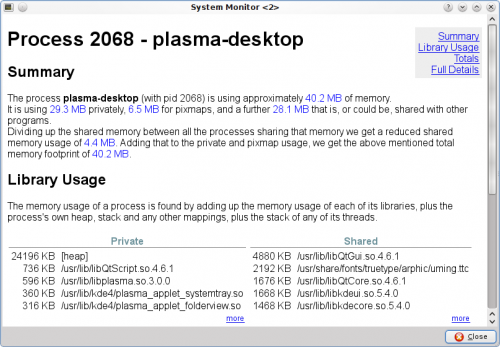
From KDE SC 4.4 you will be able to select a process in the table, right click on the process, and choose , and get something like:
Why do values in Detailed Memory Information not match the process list?
The process list in System Activity is using an approximation to gather the values. The gives more accurate values.
Why is the "Xorg" process using so much memory?
This is the process that displays all the other applications. Its memory usage includes all the memory used on the video card to store all the pixmaps (images) from applications.
In general you do not need to worry about the memory usage of Xorg.
How do I see the PID of a process?
If you want to see the PID of a single process, hover the mouse cursor over the name of the process. The PID will be shown in the tooltip.
If you want to see the PID of all the processes, right click on any column heading and you will see the menu:
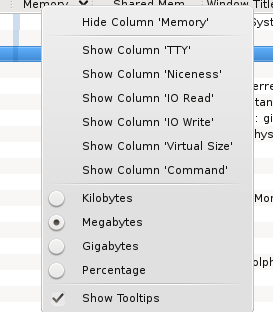
Choose .
Can System Activity show the I/O Hard Disk usage, like iotop?
Right click on the column headings, and choose and again for . It will now show the amount of data being sent to or from the hard disk.
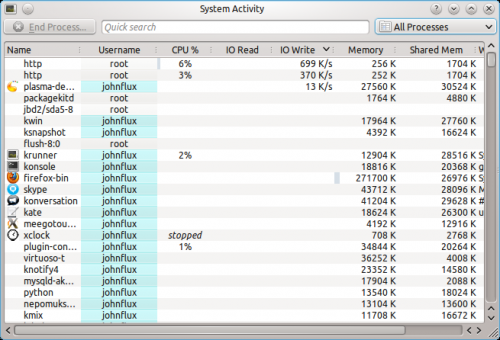
By right clicking on the column header you can chose whether you want to view the actual amount of data being written or read from the hard disk (the default), or whether you are interested in seeing how much data the application is sending or requesting from a file.
Data requested and actual data read from the hard disk are not equivalent - for example, if two applications read from the same file the operating system does not need to read from the actual hard disk twice - it can just read it once and remember it for a short while. Similarly, if one process writes to a file, but then another process writes over the top of that same file, there's no point writing the first version of the file to the actual hard disk.
Why are some processes grayed out?
For example the process xclock:

This means that the process has already died. It is shown as a disabled
process just for convenience to make it easier to see processes that are quit.
The values for the CPU usage, Memory usage, etc are just the values from when the process was last seen alive. A process that has ended does not take up any resources (it uses no CPU, memory etc).
What are all of these processes owned by root and taking up no memory?
These are kernel threads. They exist only inside the kernel, and exist to allow the kernel to perform multiple tasks in parallel.
They are shown because occasionally they can be a cause of heavy CPU usage. For example, under a heavy load, and with bad drivers, a network card can produce a huge number of interrupts, resulting in a high CPU usage in the ksoftirqd kernel thread.
Likewise, a high CPU usage in kjournald can indicate that DMA transfer is not enabled on the hard disk.
Why do I have so many processes?
A normal average-user system has around 150 to 200 processes with strange sounding names. It would be nice to setup a wiki page giving a short description of each of these processes, but so far nobody has done this. ![]()
Why is OpenOffice.org not showing up as a graphical program?
Before version 3.3, OpenOffice.org did not correctly implement the window standards. Specifically, their windows did not set _NET_WM_PID to link the windows to the process. This is now fixed in OpenOffice.org 3.3.
Why is gvim showing up strangely as a graphical program?
This is a fault with the GVim program. GVim does not correctly implement the window standards. Specifically, when it starts up it forks a new process to avoid hanging the shell that it ran from. But it sets the _NET_WIN_PID property to the previous PID. The authors have been notified but have not fixed this yet.
