KDevelop4/Manual/Fejlsøgning af programmer
Fejlsøgning af programmer i KDevelop
Kør et program i fejlsøgeren
Når du har konfigureret en opstarter (se Kør programmer), så kan du også køre det i fejlsøgeren: Vælg menuen eller tast F9</menuchoice>. Hvis du er fortrolig med '''gdb''', så er effekten den samme som at starte '''gdb''' med den kørbare fil specificeret i opstartskonfigurationen og så sige <code>Run</code>. Dette betyder, at hvis programmet et eller andet sted kalder <code>abort()</code> (fx hvis det støder på en "assertion", som ikke passer) eller hvis der forekommer en segmenteringsfejl, så vil debuggeren stoppe. Hvis programmet på den anden side kører indtil det er færdigt (hvadenten det løser sin opgave rigtigt eller ej), så vil fejlsøgeren ikke stoppe af sig selv før programmet er færdigt. I dette tilfælde har du brug for sætte et stoppunkt på alle de linjer i din kodebase, hvor du vil have fejlsøgeren til at stoppe, før du starter fejlsøgeren. Du kan gøre dette ved at placere markøren på en sådan linje og vælge menuen <menuchoice>Kør -> Slå stoppunkt til/fra</menuchoice> eller højreklikke på linjen og vælge <menuchoice>Slå stoppunkt til/fra</menuchoice> i kontekstmenuen.
[[Image:kdevelop-4.png|center|thumb|550px]]
Running a program in the debugger will put '''KDevelop''' in a different mode: it will replace all the "Tool" buttons on the perimeter of the main window by ones that are appropriate for debugging, rather than for editing. You can see which of the mode you are in by looking at the top right of the window: there are tabs named <menuchoice>Review</menuchoice>, <menuchoice>Debug</menuchoice>, and <menuchoice>Code</menuchoice>; clicking on them allows you to switch back and forth between the three modes; each mode has a set of tool views of its own, which you can configure in the same way as we configured the <menuchoice>Code</menuchoice> tools above.
Once the debugger stops (at a breakpoint, or a point where <code>abort()</code> is called) you can inspect a variety of information about your program. For example, in the image above, we have selected the <menuchoice>Frame Stack</menuchoice> tool at the bottom (roughly equivalent to '''gdb's''' "backtrace" and "info threads" commands) that shows the various threads that are currently running in your program at the left (here a total of 8) and how execution got to the current stopping point at the right (here: <code>main()</code> called <code>run()</code>; the list would be longer had we stopped in a function called by <code>run()</code> itself). On the left, we can inspect local variables including the current object (the object pointed to by the <code>this</code> variable).
From here, there are various possibilities you can do: You can execute the current line (<keycap>F10, gdb's "next" command), step into the functions (F11, gdb's "step" command), or run to the end of the function (F12, gdb's "finish" command). At every stage, KDevelop updates the variables shown at the left to their current values. You can also hover the mouse over a symbol in your code, e.g. a variable; KDevelop will then show the current value of that symbol and offer to stop the program during execution the next time this variable's value changes. If you know gdb, you can also click on the tool button at the bottom and have the possibility to enter gdb commands, for example in order to change the value of a variable (for which there doesn't currently seem to be another way).
Attaching the debugger to a running process

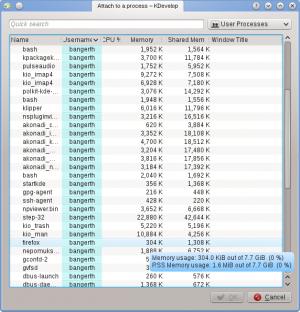
Sometimes, one wants to debug a program that's already running. One scenario for this is debugging parallel programs using MPI, or for debugging a long running background process. To do this, go to the menu entry , which will open a window like the one above. You will want to select the program that matches your currently open project in KDevelop - in my case that would be the step-32 program.
This list of programs can be confusing because it is often long as in the case shown here. You can make your life a bit easier by going to the dropdown box at the top right of the window. The default value is , i.e. all programs that are run by any of the users currently logged into this machine (if this is your desktop or laptop, you're probably the only such user, apart from root and various service accounts); the list doesn't include processes run by the root user, however. You can limit the list by either choosing , removing all the programs run by other users. Or better still: Select , which removes a lot of processes that are formally running under your name but that you don't usually interact with, such as the window manager, background tasks and so on that are unlikely candidates for debugging.
Once you have selected a process, attaching to it will get you into KDevelop's debug mode, open all the usual debugger tool views and stop the program at the position where it happened to be when you attached to it. You may then want to set breakpoints, viewpoints, or whatever else is necessary and continue program execution by going to the menu item .
Some useful keyboard shortcuts
| Debugging | |
|---|---|
| F10 | Step over (gdb's "next") |
| F11 | Step into (gdb's "step") |
| F12 | Step out of (gdb's "finish") |
