KChart/ja: Difference between revisions
Appearance
KChart |
Updating to match new version of source page |
||
| (3 intermediate revisions by 2 users not shown) | |||
| Line 1: | Line 1: | ||
<languages /> | <languages /> | ||
{{ | {{Historic|1=The functionality of this app has been incorporated in the [[Special:myLanguage/Calligra|Calligra]] apps.}} | ||
{|class="tablecenter vertical-centered" | {|class="tablecenter vertical-centered" | ||
|[[Image:Kchart_3D.png|thumb|250px]]||'''Prepare charts to embed in your documents and slideshows''' | |[[Image:Kchart_3D.png|thumb|250px]]||'''Prepare charts to embed in your documents and slideshows''' | ||
|} | |} | ||
== History == | |||
'''KChart''' was the charting tool from [[Special:myLanguage/KOffice|KOffice]] and is still the charting tool from [[Special:myLanguage/Calligra|Calligra]]. In older version, '''KChart''' was a standalone application, now it's a part with KGantt of the '''KDiagram''' library used by other KDE applications (e.g. [[Special:myLanguage/Calligra|Calligra]] and [[Special:myLanguage/KMyMoney|KMyMoney]])<ref>[https://phabricator.kde.org/T2110 KChart is part of KDiagram]</ref>. | |||
== Features == | |||
''Features include:'' | ''Features include:'' | ||
| Line 28: | Line 33: | ||
** Polar: normal | stacked | percent | ** Polar: normal | stacked | percent | ||
== | == References == | ||
[[Category:Office]] | [[Category:Office/ja]] | ||
Latest revision as of 04:01, 19 May 2024
 |
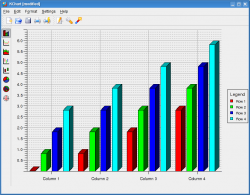
Prepare charts to embed in your documents and slideshows |
History
KChart was the charting tool from KOffice and is still the charting tool from Calligra. In older version, KChart was a standalone application, now it's a part with KGantt of the KDiagram library used by other KDE applications (e.g. Calligra and KMyMoney)[1].
Features
Features include:
- Ease of use
- Default values for all parameters are relative to window size
- All parameters may be edited after drawing the chart
- Choice of legend placement
- Header and footer have font settings defined separately from other fonts

- Multiple Chart types
- Bar: normal | stacked | percent, 2D | 3D-Look
- Line: normal | stacked | percent, line markers
- Area: normal | stacked | percent
- HiLo: normal | open-close
- Box & Whiskers
- Pie: normal | exploded, 2D | 3D
- Ring
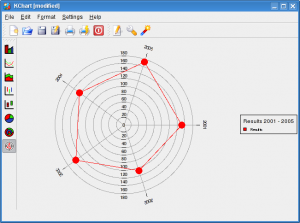
- Polar: normal | stacked | percent

