QtiPlot: Difference between revisions
Appearance
Pipesmoker (talk | contribs) No edit summary |
No edit summary |
||
| (6 intermediate revisions by 4 users not shown) | |||
| Line 1: | Line 1: | ||
<languages /> | |||
{{Proposed deletion|Not KDE project}} | |||
<translate> | |||
<!--T:1--> | |||
{|class="tablecenter vertical-centered" | {|class="tablecenter vertical-centered" | ||
|[[Image:QtiPlot_logo.png]] | |[[Image:QtiPlot_logo.png]] | ||
| Line 4: | Line 10: | ||
|} | |} | ||
==Features== <!--T:2--> | |||
==Features== | |||
<!--T:3--> | |||
* Presents 2D and 3D data. | * Presents 2D and 3D data. | ||
* Includes various data analysis functions like linear and non linear curve fitting. | * Includes various data analysis functions like linear and non linear curve fitting. | ||
* Rendering 3D using OpenGL using the Qwt3D libraries. | * Rendering 3D using OpenGL using the Qwt3D libraries. | ||
* Python scripting | * Python scripting | ||
* Various export formats (Bitmaps and Vector) | * Various export formats (Bitmaps and Vector) | ||
==Screenshots== | ==Screenshots== <!--T:4--> | ||
<!--T:5--> | |||
{|class="tablecenter vertical-centered" | {|class="tablecenter vertical-centered" | ||
| [[Image:QtiPlot_Screenie.png|center|300px]] | | [[Image:QtiPlot_Screenie.png|center|300px]] | ||
| Line 25: | Line 30: | ||
|} | |} | ||
==Weblinks== | ==Weblinks== <!--T:6--> | ||
* [ | <!--T:7--> | ||
* [http://soft.proindependent.com/doc/manual-en/index.html | * [https://www.qtiplot.com/ QtiPlot Homepage] | ||
* [http://soft.proindependent.com/doc/manual-en/index.html QtiPlot Manual] | |||
<!--T:8--> | |||
[[Category:Science]] | [[Category:Science]] | ||
</translate> | |||
Latest revision as of 13:50, 23 April 2024
| QtiPlot analyzes and visualizes scientific data. |
Features
- Presents 2D and 3D data.
- Includes various data analysis functions like linear and non linear curve fitting.
- Rendering 3D using OpenGL using the Qwt3D libraries.
- Python scripting
- Various export formats (Bitmaps and Vector)
Screenshots
 |
 |
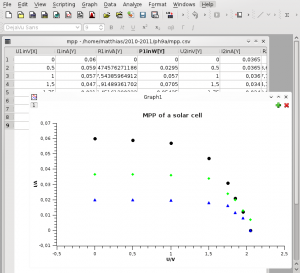
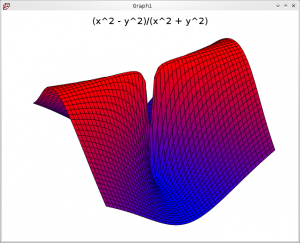
| Simply plotting some data from a table. | 3D plot of a surface with a singularity at the origin. |

