Plan/Engineering To Order project tutorial/executing/da: Difference between revisions
Importing a new version from external source |
Importing a new version from external source |
||
| Line 22: | Line 22: | ||
=== Diagram over projektpræstation === | === Diagram over projektpræstation === | ||
På nuværende tidspunkt viser projektpræstations-diagrammet basislinjen og tilstanden før start. Det skulle se sådan ud: | |||
Revision as of 07:42, 7 January 2011
Gennemførelse og kontrol
Det er tid til at gå i gang med projektet. Efter nogen tid indsamler vi den nødvendige information i form af færdiggørelsesprocenter, arbejdstimer og udgifter.
Gantt-kort
Nu, da vi har basislinjen, har vi forberedt alle de data, der skal bruges i det næste trin, som er at kontrollere arbejdsprocessen. Før vi gør det, skal vi tjekke at alt er i orden. I Gantt-diagrammet kan få et overblik over projektet og er derfor i stand til visuelt at overskuer, om der er fejl.
Klik på i visningsvælgeren. Du skulle nu se noget i retning af dette
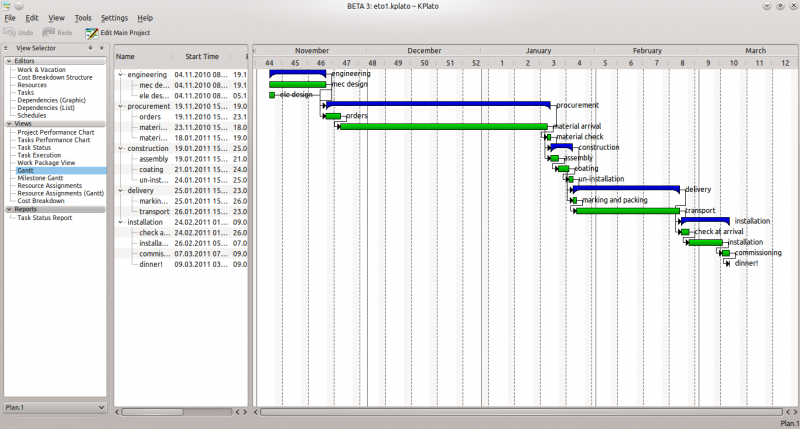
Du kan også indstille Gantt-diagrammet til at vise planlægningsfejl!
Hvis alt ser rigtigt ud, så fortsætter vi.
Diagram over projektpræstation
På nuværende tidspunkt viser projektpræstations-diagrammet basislinjen og tilstanden før start. Det skulle se sådan ud:
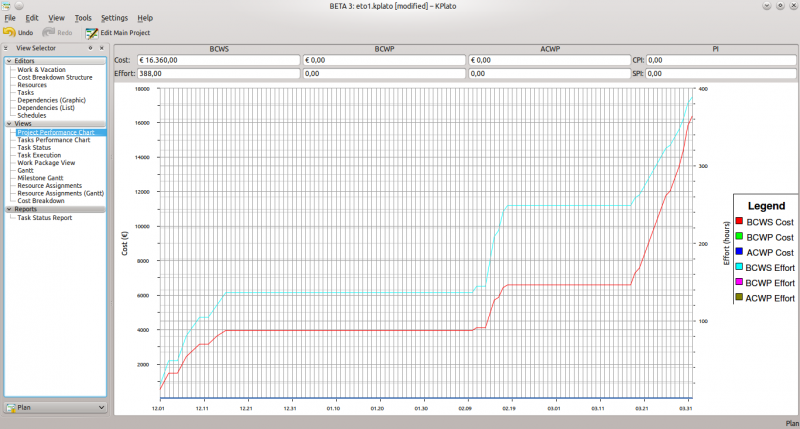
Where BCWS means Budgeted Cost Work Scheduled, BCWP means Budgeted Cost Work Performed, ACWP means Actual Cost Work Performed. All these are considered as effort and costs. PI are the Performance Indexes, where CPI is the Cost Performance Index and SPI is the Schedule Performance Index.
Task performance chart
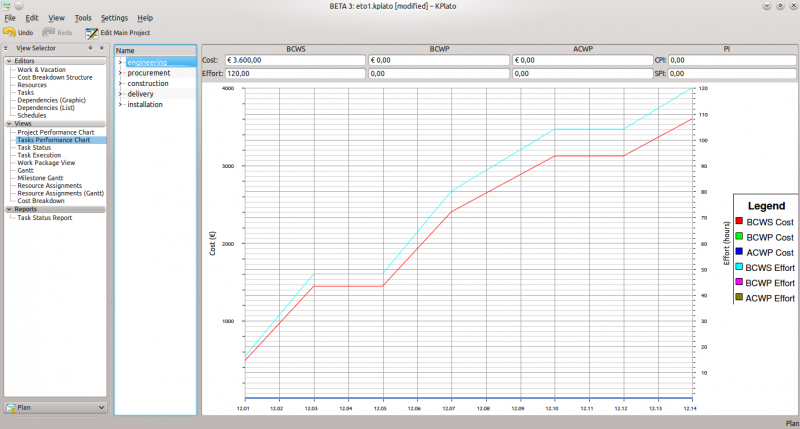
On the we can analyse deeply each task or group of tasks with the same index as before.
This is really useful in long and complicated project.
Task status
In the , you can check the actual situation of the project. Can be used as a daily check!
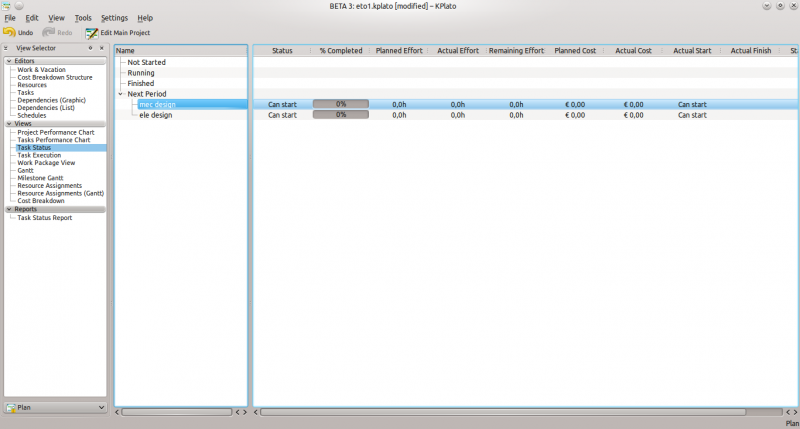
Is it time to simulate some work now!
So, let's start to enter some value, right clicking on the activity in the mec design and choose from the menu that appears. This will appear!
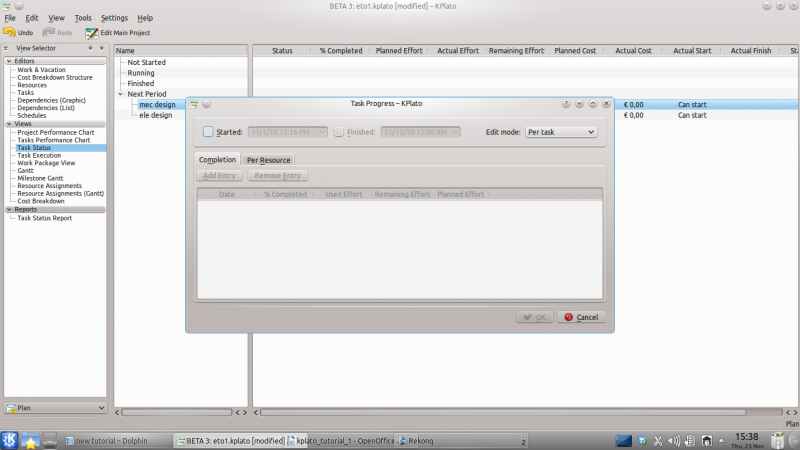
In this task progress window, we can choose to define the starting date of the task. Click on the button on the upper right corner of the window and choose the date.
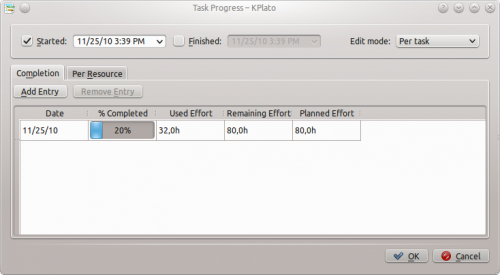
Than we choose to add a completion percentage for the task, clicking on the add entry in the tab completion. Then click on the field and move the cursor that appears up to 20%. On the field at the right you can insert the effort used, in this case we will insert 32.
The final window will be like this one:
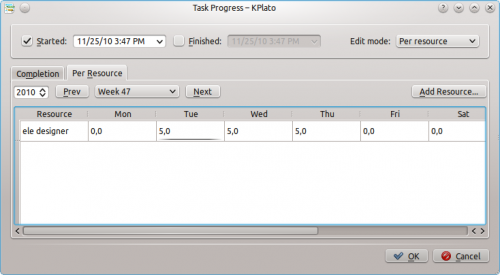
Now we do the same for the second task that can be started, the "ele design". But for this task we choose the edit mode as and compile the relative tab with 5 hours per day on Tue, Wed and Thu. The result will be like below:
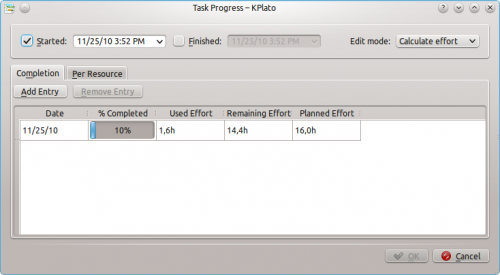
Then we move briefly to the and choose the task and insert the progression using the edit mode. Choosing the date we started and the % complete to 10%, the effort will be calculated automatically and the result should be like below:
then moving to the menu we'll find the following:
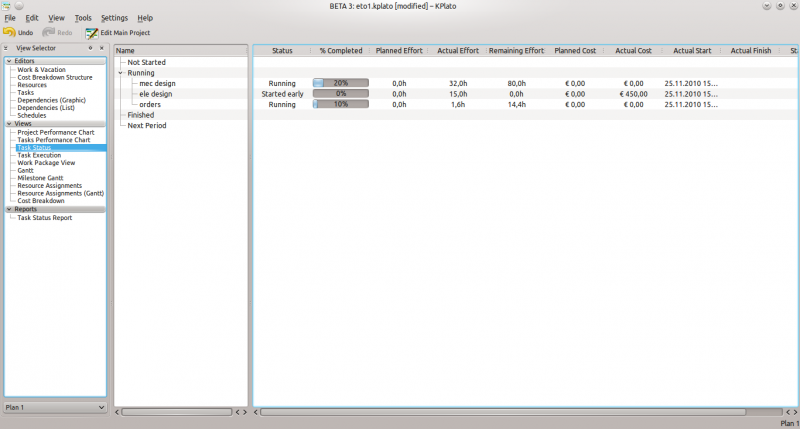
Task execution
In the task execution we can have a general view of the things going on.
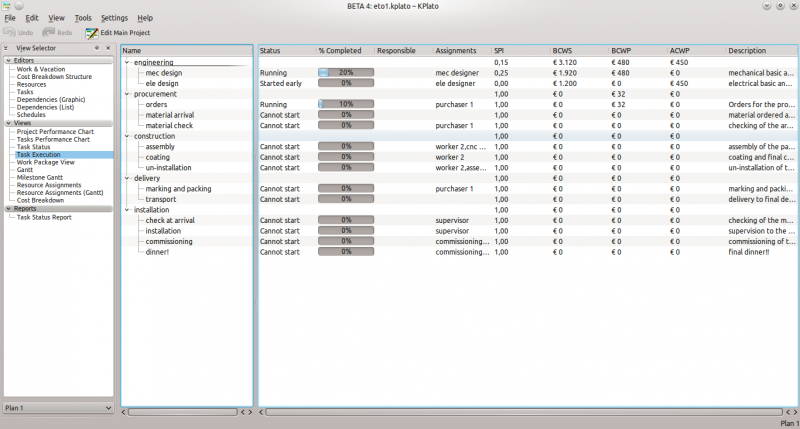
This is a reasonable view to have a general check!
Gantt
The Gantt menu is a typical Gantt diagram where you can have a clear picture about the sequence and the duration of the project. With our example, it will be like this.
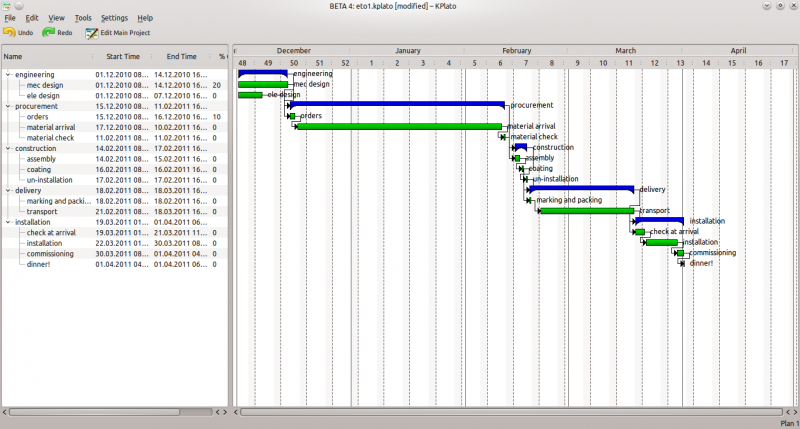
To have a better view of the Gantt diagram, it's possible to work on the zoom. This can be done by right-clicking on the upper part of the diagram where there are the months and days. This menù will appear:
[Image:kplato_gantt3.png|center|500px]]
With this menu it's possible to change the scale or the zoom in/out. Most useful could be the "zoom..." selection that can zoom in or out by a small menu. Try it!!
Milestone Gantt
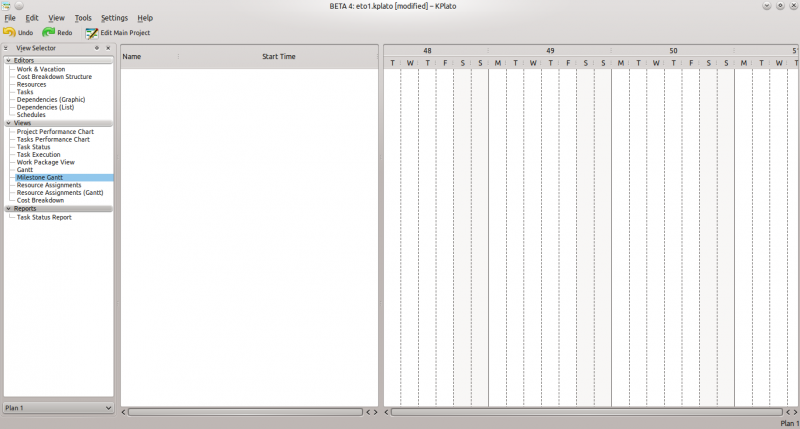
Milestone Gantt is a part of the Gantt diagram with a filter only to the milestones. In this project we do not have any, so the window will be blank!
Resource assignment
The Resource Assignment view let's you check which resource is used in which day, how many hours and for what.
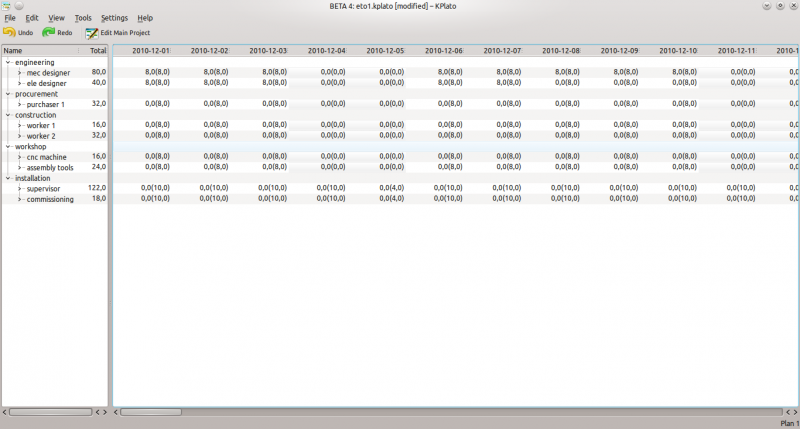
On the right window, between brackets are the hours of availability while just before the brackets the hours used for that resource.
Resource assignment gantt
The Resource Assignment Gantt is a Gantt diagram with the resource data. Can be useful to visualise the working period of the resources as well as quickly check about some availability to anticipate some tasks!
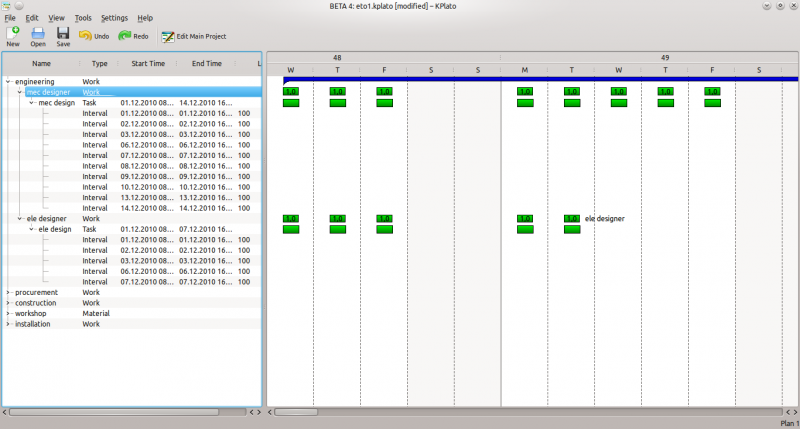
In this view we can see that the first resource is fully used for the first 3 days as in the main row related to the resource is written 1.0, this means 100%. then on the sub rows of the resource we can see the tasks and the time spent for each task.
Cost breakdown
The Cost Breakdown view represents the result of the accounting of the various tasks cost, generated according the cost assignment in the task and the cost breakdown structure that we decided at the beginning of the job.
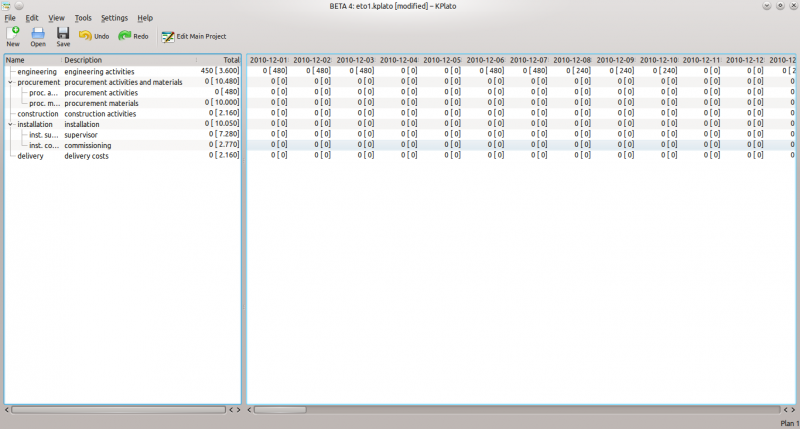
On the left windows, in the total column, between brackets there's the total sum for the project according the task, while just before the brackets is the actual total expenses.
Reports
Reports are still in a early stage but you can choose to export as pdf some views, which can be good as the report!


