Showfoto/Curves Adjust/bg
Фото KDE Урок 1-2 - Настройки с Curves
Унай Гаро (uga) - Лято 2008
Това е втората част от уроци, имащи за цел да ви запознаят с инструментите на "KDE" (а именно ShowFoto и/или Krita), за обработка на изображения. Първата част ви запозна с боравенето с хистограма и цветови нива. Този урок ще ви покаже как да ползвате един по- сложен и мощен инструмент- Curves Adjust. Като по- усъвършенстван, боравенето с този инструмент изисква търпение и натрупване на практика, за да бъдат постигнати добри резултати.
Нека започнем. За този урок ще боравим с дадената по- долу снимка, любезно предоставена от Джос ван дер Оевер.
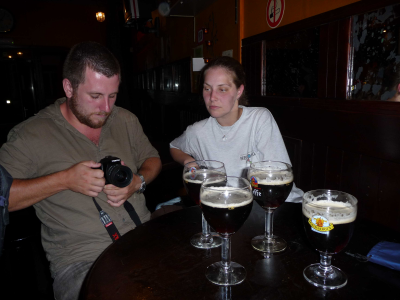
Проблемът с тази снимка е, че има зони, които са прекалено тъмни. Хората на снимката се виждат ясно, но фонът е тъмен и трудно можем да видим заведението в детайли. Нека първо видим, какво ще се получи ако използваме инструмента от първия урок- Levels:
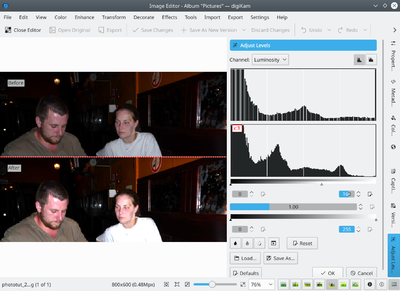
Както виждате, някои части на снимката се пренасищат, ако използваме "Levels". Това означава, че има зони от изображението, които са в дясната област на хистограмата и след промяната- стават бели. Това идва от факта, че за разлика от снимката от предишния урок, цветовете на сегашното изображение, не са съсредоточени в левия край на хистограмата. Тук цветовете са разпределени по цялата и дължина. Затова, когато променяме нивата, снимката губи имформация.
Защо се случва това? Защото снимката и ситуацията, която изобразява са с "High Dynamic Range", т.е. присъстват обекти с много тъмни (фонът), до много светли цветове (зоните, осветени от светкавицата).
In this sort of images, if we try moving the input sliders of the levels tool, we will delete part of the photo's gray level information, losing details, and the result isn't nice.
So what to do now? We can use the from the menu : ![]()
Selecting this option will show a new popup with a dialog that may look similar to the levels tool. You can see the resulting histogram on top, and the input histogram on the bottom, just like in the levels tool:
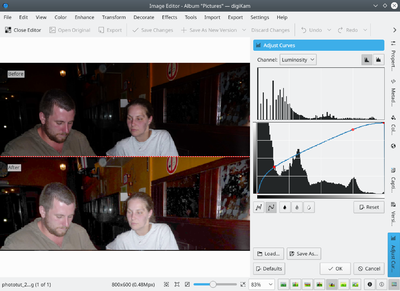
The difference is in the way the control works. In this tool, the input histogram has a diagonal line in it. Clicking on it with the left button of the mouse, adds control points. You can move those control points up or down. The result, as shown in the picture above, is that the gray levels from the horizontal axis are converted into the gray levels in the vertical axis.
Moving the control points up, makes that part of the image brighter. Moving them down, makes that part of the image darker.
In this case, I wanted to make the darkest parts of the image brighter, so I added a control point on the left part of the histogram, and moved the point upwards. As the rest of the image was also getting a bit too bright, I added a second control point to avoid it.
So, lets press and see what we get of it:
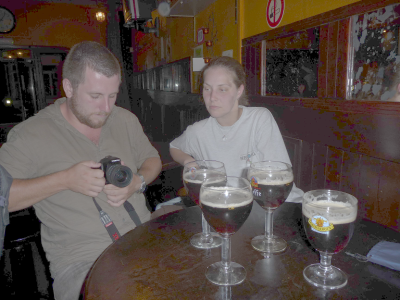
We have managed to make the shadows brighter, and now the pub is more visible, but the image is now a bit washed out. As if it were too bright all over the place. Can we do something? Sure, lets try the levels adjustment again:
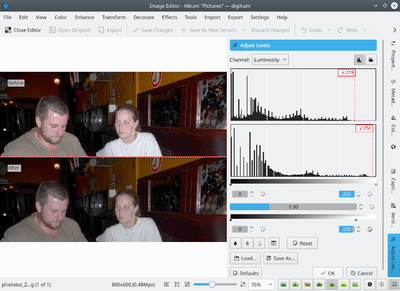
Now that the shadows were adjusted using the curves, and the colors are more uniform, we can follow the method shown in the first tutorial and adjust the levels of the photo, as shown above. The histogram's main data was a bit displaced to the left, and adjusting levels, I made it cover the whole range again.
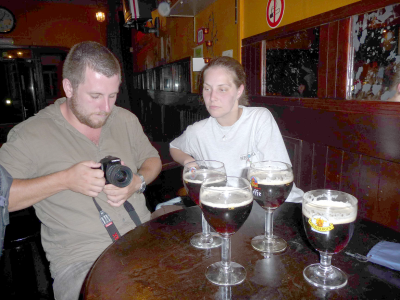
Lets see the result - Ah, now this is much better. The pub background is much more visible and the two persons are not blown:
I think that's already acceptable, but if we are picky, the two people are a bit washed out due to the flash light. So, even if that goes out of the scope of this tutorial (it'll be covered in the following tutorials), lets adjust a bit the saturation and contrast in the image for a better result:
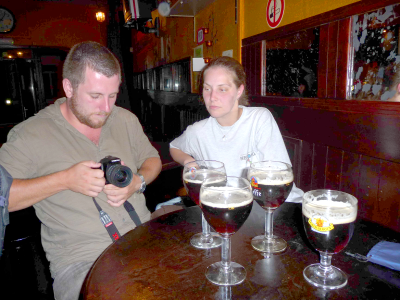
Now this image looks much nicer than the original, yes. I hope you liked this tutorial and will see you in the next one!

