QtiPlot
| QtiPlot analyzes and visualizes scientific data. |
Features
- Presents 2D and 3D data.
- Includes various data analysis functions like linear and non linear curve fitting.
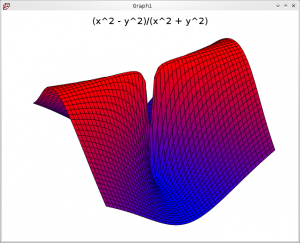
- Rendering 3D using OpenGL using the Qwt3D libraries.
- Python scripting
- Various export formats (Bitmaps and Vector)
Screenshots
 |
 |
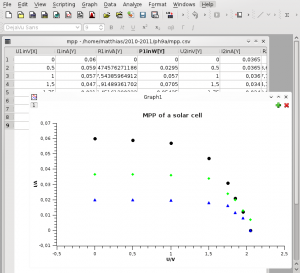
| Simply plotting some data from a table. | 3D plot of a surface with a singularity at the origin. |

