Kexi/Vejledninger/Rapporter/Rapporter i Kexi for begyndere
← Tilbage til Vejledninger/Rapporter
← Tilbage til vejledninger
Dette er en grundlæggende vejledning for begyndere i at lave rapporter i Kexi 2.2 eller nyere.
Vi begynder med en tabel ved navn masterlb vist i dataformat. I dette eksempel hedder felterne author, title, keywords og så videre. Før vi kan lave en rapport, skal vi lave en forespørgsel.
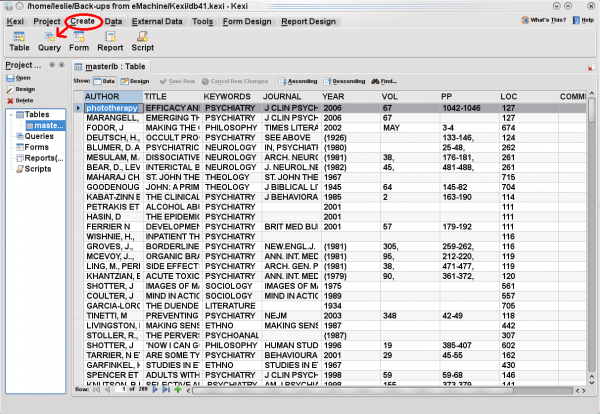
Vælg kommandoen i hovedværktøjslinjens faneblad .
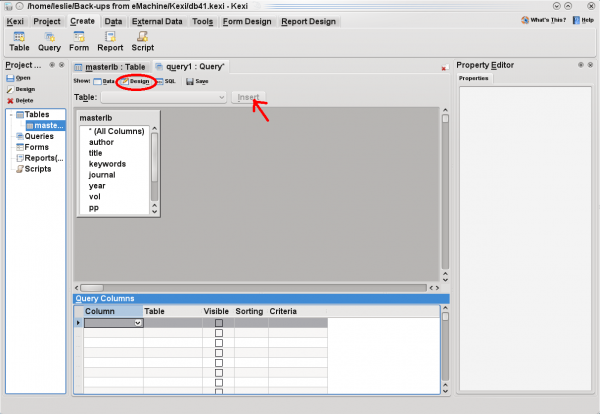
I -visningen vælger du den ønskede tabel fra komboboksen og klikker på knappen . En boks, som repræsenterer den valgte tabel dukker op med en liste af feltnavne. Dobbeltklik på hvert felt du vil have med i din forespørgsel.
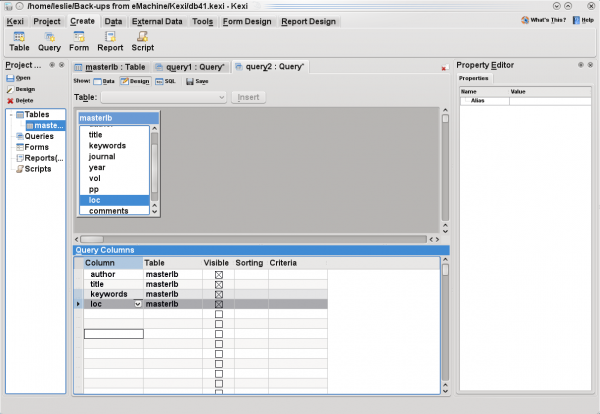
The query columns will automatically fill with your field selections and with the table name, as shown next.
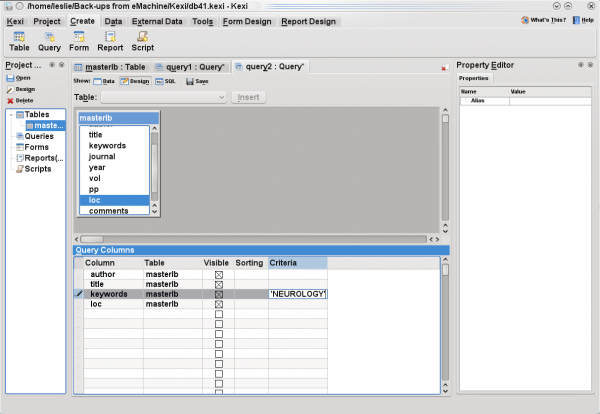
Let's suppose that, for your report, you want all the records matching NEUROLOGY in the field keywords. Under on the line,type in
'NEUROLOGY'
(Enclose the name in single quotes.)
Now, select the button to save your query. You will be asked for name of the saved query; enter
neurology
. In the screen shot below, name this new query is displayed under category in the far left pane.
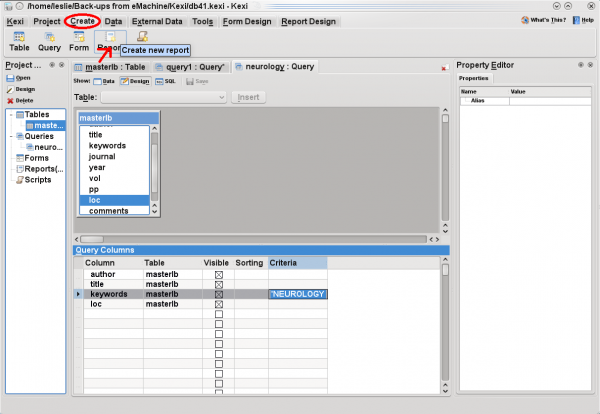
Next, to create new report that will display data defined by the query, select the command from the tab of the main toolbar.
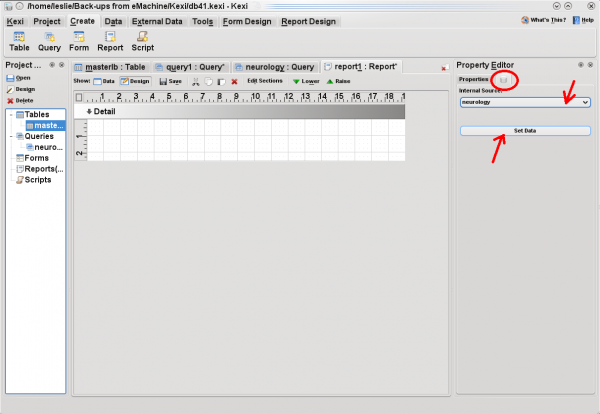
Click on the tab with database icon, to the right of . You will then be able to select an internal source for your report. The new query will be among the choices. Select it, and press the button.
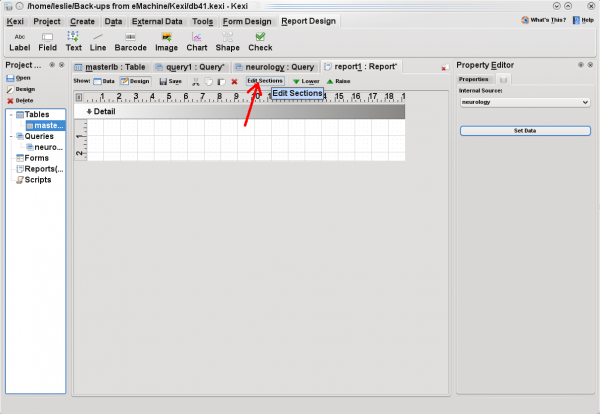
At this point, before entering your data, you may wish to click button to create a header and other format options:
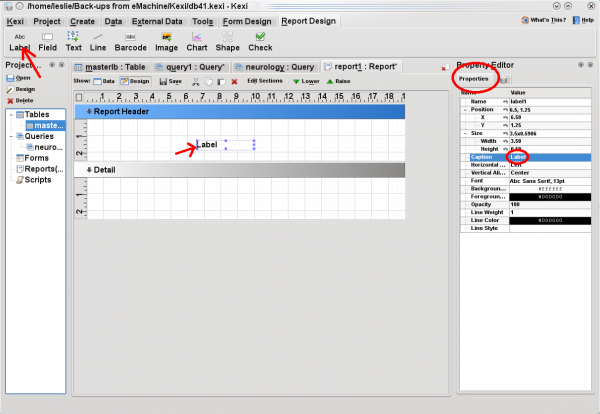
You may wish to put a label in your header. To do so, click on command from the tab of the main toolbar
and then click in the area.
Notice that in the you can enter your own to replace the word Label. You have many options for formatting the size, position, font, etc.
To enter fields into the body of your report, click on command in the tab of the main toolbar and then click in the section. In the , pressing on the property combo box displays a list of the fields provided by your query. For each field you create in the section, select desired field from the list. This binds the fields on your report to your data.
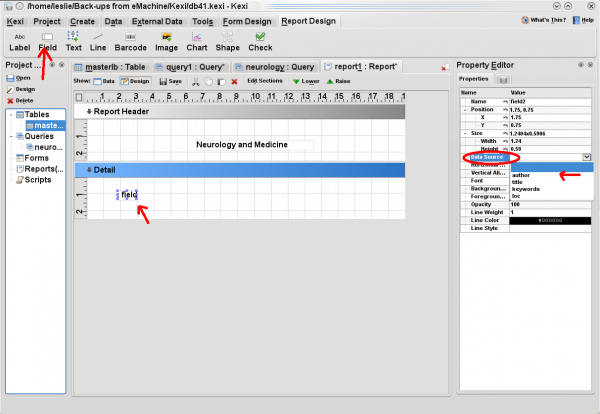
Again, there are many formatting options. Save your report using the button. Before you switch to data mode, if you have set the data for the first time, you may have to close and re-open the report [this may be a bug that will be fixed in later versions].
When you switch to data mode, you have several options, including command. Your printed report should look great!
Author undisclosed. Text adopted and edited by jstaniek.

