Plasma/NetworkMonitor/es: Difference between revisions
Created page with "==Elemento gráfico Monitor de red==" |
Created page with "{|class="tablecenter vertical-centered" |128px||'''Elemento gráfico Monitor de red - Utilízalo para ver la actividad de tu red''' |} {{Tip/es|1=[[S..." |
||
| Line 3: | Line 3: | ||
{|class="tablecenter vertical-centered" | {|class="tablecenter vertical-centered" | ||
|[[File:Network_monitor.png|128px]]||''' | |[[File:Network_monitor.png|128px]]||'''Elemento gráfico Monitor de red - Utilízalo para ver la actividad de tu red''' | ||
|} | |} | ||
{{Tip|1=[[Special:myLanguage/Plasma/Installing_Plasmoids| | {{Tip/es|1=[[Special:myLanguage/Plasma/Installing_Plasmoids|Sigue las instrucciones para añadir un plasmoide/elemento gráfico]]}} | ||
A very simple ''widget'' which displays a graph of activity on your network connections. | A very simple ''widget'' which displays a graph of activity on your network connections. | ||
Revision as of 11:42, 3 January 2011
Elemento gráfico Monitor de red
 |
Elemento gráfico Monitor de red - Utilízalo para ver la actividad de tu red |
A very simple widget which displays a graph of activity on your network connections.
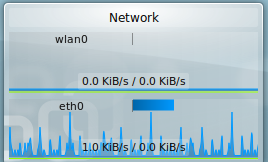
Each of your installed network connections displays as a graph which updates every 2 seconds to display activity. The graph automatically scales to the highest level of data transfer in the cycle (which lasts several minutes). Therefore, during very inactive periods, the display will show the low level of steady network connections (to your router for routine "are you there?" sorts of data).
Going along with no file transfers for a while, very low network activity creates a graph which reflects 1 to 2 KiloBits per second activity which fills the widget graph space.

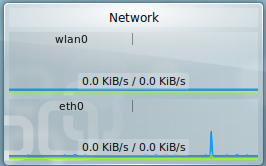
Then, a spike of activity happens, and the scaling resets so that the spike sets the graph scale and the low level activity becomes a ripple at the bottom of the scale.

That spike moves across the display over a period of several minutes. When the spike cycles off the display, the scaling changes, suddenly, to show the low level of activity at full scale. The sudden "appearance" of activity all across the graph can make a person think that the network is behaving strangely. It isn't.
There are settings. You can choose to change which network interfaces show. In the example images both the wired ethernet (eth0) and Wireless (wlan0) connections show, but I could have turned off the wireless while not using it.

