Plasma/NetworkMonitor/es: Difference between revisions
Created page with "Siguiendo con que no hay transferencias de archivos por un tiempo, la baja actividad de red crea un gráfico que refleja de 1 a 2 KiloBits por segundo de actividad y que rellena ..." |
Created page with "300px|thumb|center|Bajo nivel de actividad" |
||
| Line 13: | Line 13: | ||
Siguiendo con que no hay transferencias de archivos por un tiempo, la baja actividad de red crea un gráfico que refleja de 1 a 2 KiloBits por segundo de actividad y que rellena el espacio del elemento gráfico. | Siguiendo con que no hay transferencias de archivos por un tiempo, la baja actividad de red crea un gráfico que refleja de 1 a 2 KiloBits por segundo de actividad y que rellena el espacio del elemento gráfico. | ||
[[File:NetScaling1.png|300px|thumb|center| | [[File:NetScaling1.png|300px|thumb|center|Bajo nivel de actividad]] | ||
Then, a spike of activity happens, and the scaling resets so that the spike sets the graph scale and the low level activity becomes a ripple at the bottom of the scale. | Then, a spike of activity happens, and the scaling resets so that the spike sets the graph scale and the low level activity becomes a ripple at the bottom of the scale. | ||
Revision as of 11:49, 3 January 2011
Elemento gráfico Monitor de red
 |
Elemento gráfico Monitor de red - Utilízalo para ver la actividad de tu red |
Un elemento gráfico muy sencillo que muestra en un gráfico la actividad de tus conexiones de red.
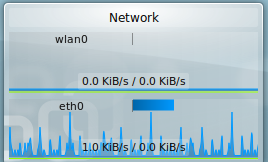
Por cada una de tus conexiones se muestra un gráfico que se actualiza cada 2 segundos para mostrar la actividad. El gráfico se escala automáticamente al nivel más alto de transferencia de datos en el ciclo (que dura varios minutos). Por lo tanto, durante períodos de muy baja actividad, la pantalla mostrará un nivel bajo de conexiones constantes (datos hacia tu router con la rutina "¿estás ahí?").
Siguiendo con que no hay transferencias de archivos por un tiempo, la baja actividad de red crea un gráfico que refleja de 1 a 2 KiloBits por segundo de actividad y que rellena el espacio del elemento gráfico.

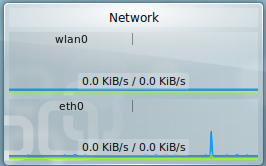
Then, a spike of activity happens, and the scaling resets so that the spike sets the graph scale and the low level activity becomes a ripple at the bottom of the scale.

That spike moves across the display over a period of several minutes. When the spike cycles off the display, the scaling changes, suddenly, to show the low level of activity at full scale. The sudden "appearance" of activity all across the graph can make a person think that the network is behaving strangely. It isn't.
There are settings. You can choose to change which network interfaces show. In the example images both the wired ethernet (eth0) and Wireless (wlan0) connections show, but I could have turned off the wireless while not using it.

