Plasma/NetworkMonitor/da: Difference between revisions
Created page with 'I forbindelse med en periode uden filoverførsel og dermed meget lille netværksaktivitet vises en graf med en aktivitet på 1 til 2 kiloBits per sekund, som fylder grafen.' |
Created page with '300px|thumb|center|Lavt aktivitetsniveau' |
||
| Line 13: | Line 13: | ||
I forbindelse med en periode uden filoverførsel og dermed meget lille netværksaktivitet vises en graf med en aktivitet på 1 til 2 kiloBits per sekund, som fylder grafen. | I forbindelse med en periode uden filoverførsel og dermed meget lille netværksaktivitet vises en graf med en aktivitet på 1 til 2 kiloBits per sekund, som fylder grafen. | ||
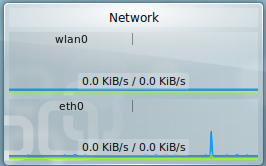
[[File:NetScaling1.png|300px|thumb|center| | [[File:NetScaling1.png|300px|thumb|center|Lavt aktivitetsniveau]] | ||
Then, a spike of activity happens, and the scaling resets so that the spike sets the graph scale and the low level activity becomes a ripple at the bottom of the scale. | Then, a spike of activity happens, and the scaling resets so that the spike sets the graph scale and the low level activity becomes a ripple at the bottom of the scale. | ||
Revision as of 06:44, 25 September 2010
Systemovervågning - netværk
 |
Systemovervågning - netværk - Brug dette widget til at overvåge din netwærksaktivitet |
Et meget enkelt widget, som viser en graf over aktiviteten på dine netværksforbindelser.
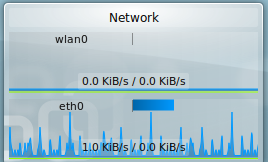
For hver af dine installerede netværksforbindelser vises en graf over aktiviteten, som opdateres hvert andet sekund. Grafen skaleres automatisk til det højeste niveau af dataoverførsel i cyklussen (som varer adskillige minutter). Under meget inaktive perioder vises derfor det lave niveau for løbende netværksforbindelser (til din router med de rutinemæssige "er du der?"-agtige data).
I forbindelse med en periode uden filoverførsel og dermed meget lille netværksaktivitet vises en graf med en aktivitet på 1 til 2 kiloBits per sekund, som fylder grafen.

Then, a spike of activity happens, and the scaling resets so that the spike sets the graph scale and the low level activity becomes a ripple at the bottom of the scale.

That spike moves across the display over a period of several minutes. When the spike cycles off the display, the scaling changes, suddenly, to show the low level of activity at full scale. The sudden "appearance" of activity all across the graph can make a person think that the network is behaving strangely. It isn't.
There are settings. You can choose to change which network interfaces show. In the example images both the wired ethernet (eth0) and Wireless (wlan0) connections show, but I could have turned off the wireless while not using it.

