KSysGuard/zh-cn: Difference between revisions
m Created page with "==系统负载==" |
m Created page with "<menuchoice>系统负载</menuchoice>屏有3个显示图表,每个分别描绘如下负载要素 - 「CPU历史」,「内存和交换文件空间历史」,「网络历史..." |
||
| Line 10: | Line 10: | ||
==系统负载== | ==系统负载== | ||
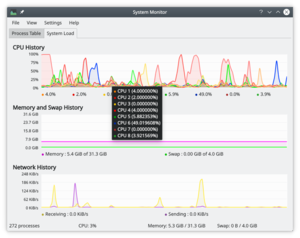
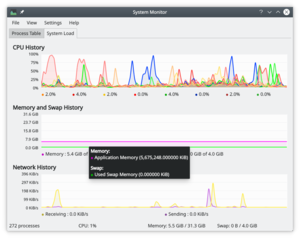
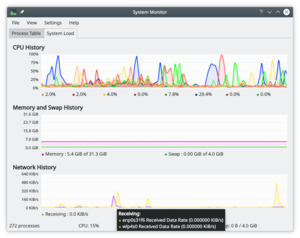
<menuchoice>系统负载</menuchoice>屏有3个显示图表,每个分别描绘如下负载要素 - 「CPU历史」,「内存和交换文件空间历史」,「网络历史」。如果你悬停鼠标指针到每个部分的,你会看到带有颜色的详细分析。 | |||
{|class="tablecenter" | {|class="tablecenter" | ||
Revision as of 14:31, 17 November 2010
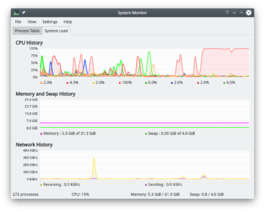 |
追踪控制系统进程. |
概述
系统监视器(KSysGuard)设计成无需使用者特别设置即可进行简单的进程控制 - 默认的通常完全够用。有两张工作表 - (上面是图表)和。
系统负载
屏有3个显示图表,每个分别描绘如下负载要素 - 「CPU历史」,「内存和交换文件空间历史」,「网络历史」。如果你悬停鼠标指针到每个部分的,你会看到带有颜色的详细分析。
 |
 |
 |
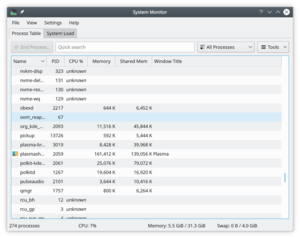
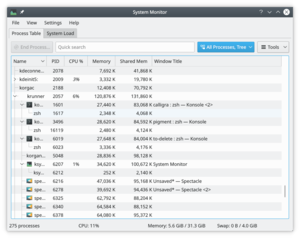
The Process Table
The view by default gives you an alphabetical order list of all processes running. Clicking on any column header will make this the sort column. If you have a runaway process you will find the view most useful. You can also elect to see sub-sets of the processes, by owner or program.
 |
 |
Hints and Tips
Ctrl + Esc brings up the Processes part of KSysGuard, which is very helpful when you are trying to find which application is using too many resources.
In KRunner (Alt + F2 or from a right-click on the desktop) there is a tiny icon to the left of the entry bar - it looks like a microwave oven - that also brings up the Process Table.
